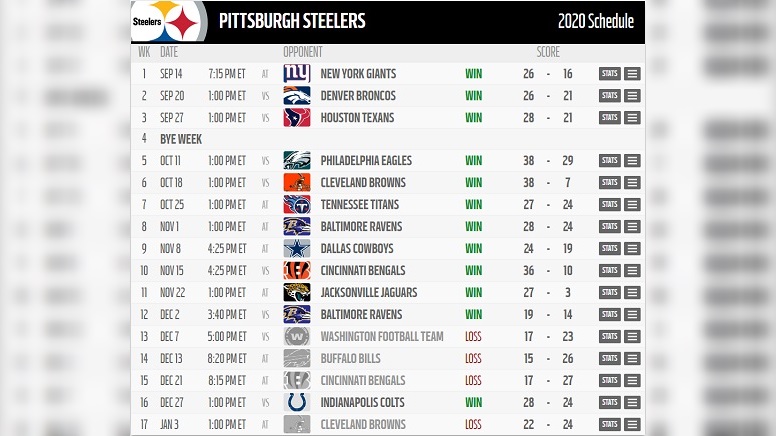
It is no secret that the Pittsburgh Steelers’ defense carried the team through the majority of the season.
But, just how influential was the defense in ending the season with a 12-4 record before being unceremoniously tossed from the playoffs by the Cleveland Browns?
By distilling the season down into individual metrics, we could explore which ones had the strongest positive relationship with victories over the course of the season.
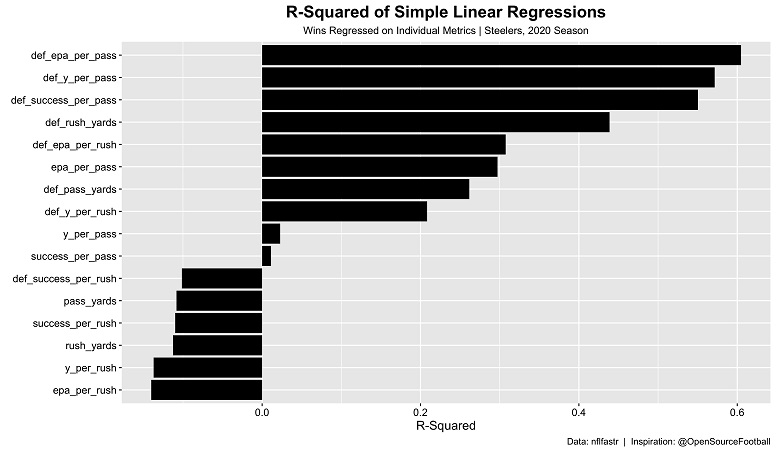
While it certainly is not the prettiest graph I have ever made, it may be the most informative.
According to the data, the defense’s expected points added per pass was responsible for just over 60-percent of the Steelers’ 12 victories this season. Not far behind that are defensive yards per pass and defensive success per pass.
In other words, the Steelers’ defense typically “removed” expected offensive points from their opponents when tested through the air. When that is the case, it isn’t surprising that defensive yards allowed per pass and defensive success per pass (which is a measure of how often the opposing offense had positive EPA per attempt) are right behind.
Perhaps unsurprisingly, defensive stats hold the top five metrics in R-Squared value in explaining the season’s total victories with defensive EPA per rush rounding out the top five. It isn’t until we get to the sixth strongest relationship that we see an offensive metric. Specifically, EPA per pass explains roughly 30-percent of the Steelers’ victories this season.
At the tail end, defensive pass yards allowed and defensive yards per rush are the last statistically significant influences on wins during the 2020 season. Offensive yards per pass and offensive success per pass barely crack the 5-percent mark.
And then we get to the ugly stuff.
Surprisingly, the data reveals defensive success per rush had a negative impact on the relationship with wins this season. However, it is to be noted that it is the only defensive stat with a negative relationship.
At the bottom of the spectrum are basically all of the offensive rushing metrics which, if you witnessed the Steelers’ rushing attack this season, make sense. Success per rush and rush yards per game are both just over the negative 5-percent mark while yards per rush and EPA per rush were the most harmful parts of the team this season on way to a 12-4 record.