**Note: This is part one of a two-part series examining the Pittsburgh Steelers’ standing against other 11-0 teams dating back to 2000. Quarterbacks and offensive/defensive lines are explored in part one. Part two will explore running backs and wide receivers.
There has been no shortage of trash talk on the Steelers’ current 11-0 record, the best start in franchise history and one of just six other franchises to start in such a fashion dating back to 2000.
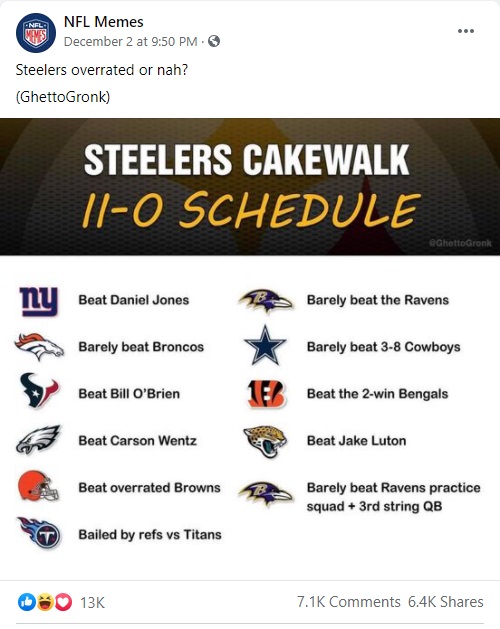
Of course, NFL Memes is in on the action highlighting that many detractors are arguing that the 11 wins is a direct result of a cakewalk schedule. It is hard to argue that our schedule has been exceedingly difficult because it has not. But, a team is only able to win the games that are scheduled for them. And, to that end, undefeated at 11-0 is just that – undefeated.
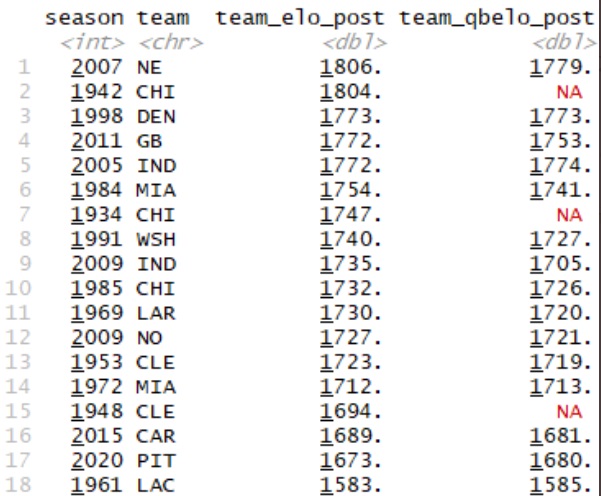
Taking a leap into some numbers, fellow analytics fan Anthony Reinhard used FiveThirtyEight’s ELO metric – which is, in short, a predictive algorithm to determine a team’s chances of making it to the playoffs and then the Super Bowl – to showcase that, according to this singular metric, the Steelers are the worst-positioned 11-0 team to make a deep run into the playoffs since the 1961 Los Angeles Chargers.
Tremendous support for my “2020 Steelers = 2015 Panthers” take https://t.co/BMg5hcMZEF
— Computer Cowboy (@benbbaldwin) December 4, 2020
Even Ben Baldwin, a Seahawks contributor for The Athletic and one of the two masterminds behind the nflfastR project, is dumping on the Steelers, insisting that Reinhard’s findings using his historical ELO metric only lends credence to Baldwin’s argument that the “2020 Steelers = 2015 Panthers.”
To be clear, that comparison to the Panthers is not a compliment.
Far from it.
In fact, if we take a look at the overall offensive expected points added (EPA) vs. the overall defensive expected points added for all 11-0 teams dating back to 2000, you will see that the Steelers are not in the greatest of spots.
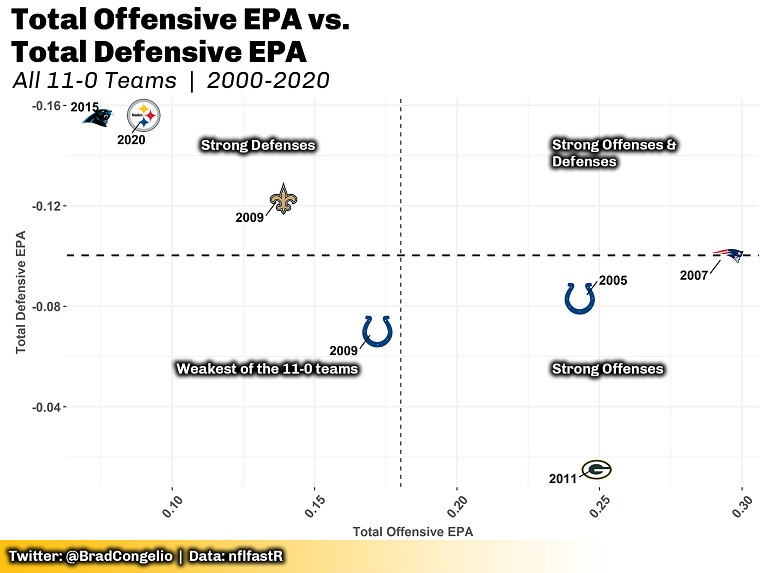
Based solely on EPA metrics, this 2020 Steelers team is being carried to an undefeated record by its defense. I don’t think that comes as a surprise to anybody, really. In fact, the Panthers and Steelers are practically tied at having the strongest defense among the teams to go 11-0 since 2000.
What is shocking, however, is how poorly the Steelers offense is performing compared to all of the other teams to go 11-0 since 2000. Even the 2009 Colts, arguably the “weakest” of the 11-0 teams based on a simple mean calculation of offensive and defensive EPA, are ahead of the Steelers.
However, only so much can be extrapolated from viewing teams this way. Case in point: the 2011 Green Bay Packers. The Packers ended the season 15-1 before being upset by the 9-7 New Giants, 37-20, in the Divisional Round (remember when the NFC East was, like, not trash?).
Aaron Rodgers went off that year, throwing for 4,643 yards and 45 touchdowns. So, despite that absolute lack of defense – which gave up the most yardage in the league at nearly 6.4 yards per play – Rodgers’ elbow literally carried that team to its record.
So while the plotting of overall EPA is fun to look at, it can often lack the small nuances that provide the needed contextualization to get the bigger picture.
Let’s start with the quarterbacks and run through some advanced metrics.
Since we started with the overall, team-wide EPA, let’s take a look at each individual quarterback’s contribution to that EPA. As well, this is filtered to only include the first 12 weeks of the season.
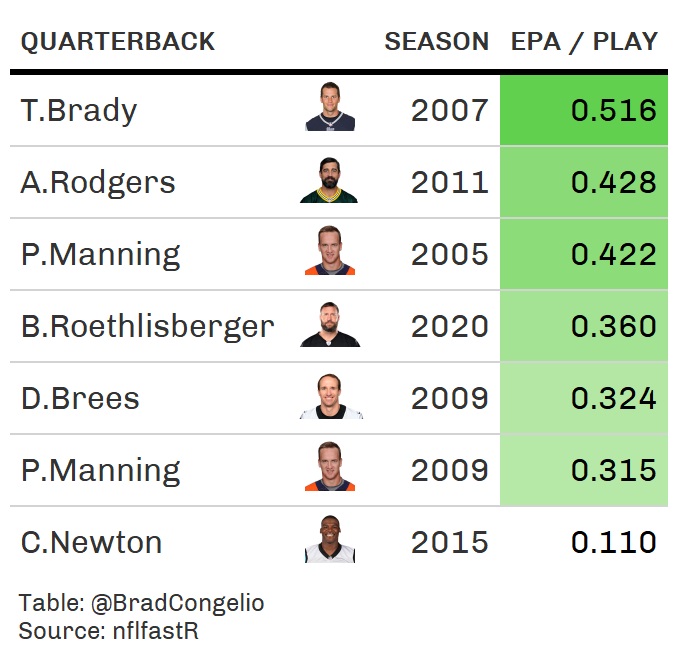
Tom Brady, then with the New England Patriots, was simply outperforming the rest of the quarterbacks in the NFL in 2007. His 72.6-percent completion percentage was leading the NFL at week 12 and his Patriots would be on the way to an undefeated regular season. As mentioned above, 2011 was a spectacular year for Rodgers, who amassed just over 0.42 expected points added per play.
For the Steelers faithful, Roethlisberger is in the middle of the pack. His 0.360 EPA per play is solid, but not great compared to the standards set by Manning, Rodgers, and Brady on their respective way to 11-0. That said, Roethlisberger could be hampered by his desire to get the ball out of his hands as quickly as possible, which means the Steelers’ short passing game is overwhelmingly used opposed to the medium or long game which could, perhaps, harm EPA.
Because of this, it is perhaps worth examining the average air yards for each quarterback.
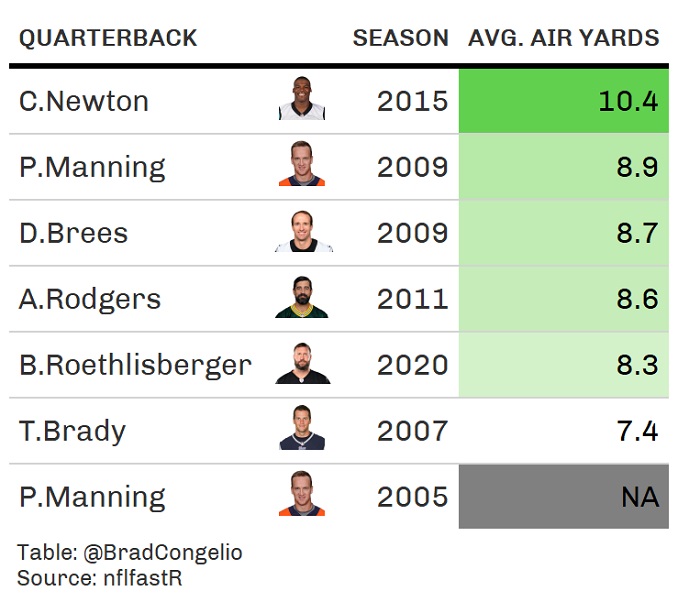
First, please note that the new few metrics we look at are relatively new and, because of this, Manning’s stats are not included.
Second, we can spot an issue right away in the average air yards chart. Roethlisberger’s low EPA compared to Manning, Rodger, and Brady cannot be attributed to less average air yards. Why?
Because Brady messes that possible correlation up.
With 7.4 average air yards per throw, Brady is nearly ten-yards under Roethlisberger’s average, yet maintained a drastically higher EPA at the week 12 mark. Perhaps, then, the Steelers’ success can be attributed to what is happening after the catch is made.
But we will get to that in part 2.
Next, let’s look at quarterback success rate. Success rate is the simple percentage of plays where the quarterback’s contribution was a net positive EPA (so, .01 or higher).
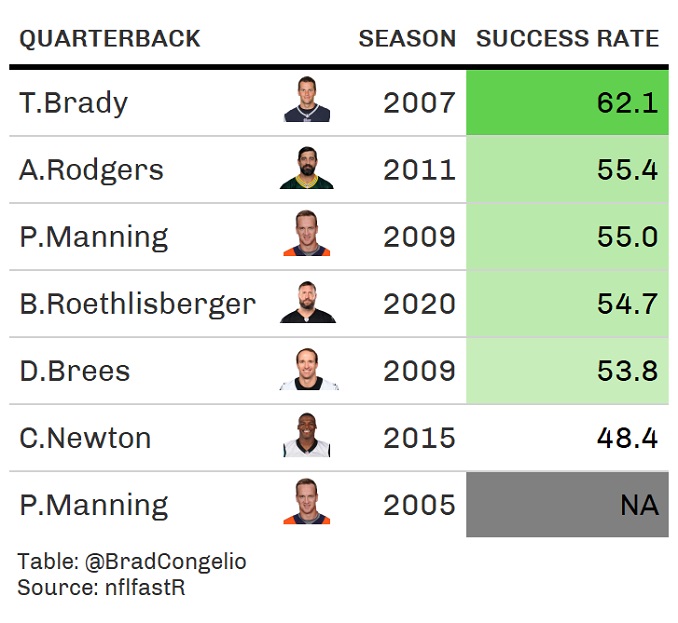
Again, we find Roethlisberger near the middle with roughly 55-percent of his personal contribution to a play’s success coming in with a positive EPA. Brady was playing on a different level in 2007, coming in at over 62-percent. Doing a quick and ugly job of it in nflfastR shows that Brady’s success rate at week 12 of the 2007 season is the highest in league history among those with an adequate number of pass attempts (note: I know there is a slight difference in Brady’s numbers between the chart and the nflfastR output … this is a result of me not filtering out penalties, DPIs, etc. in the following image).

The point is this: when it comes to success rate, if you remove Brady’s historical 2007 season, Roethlisberger is right in the mix with Manning and Rodgers. Lastly with the quarterbacks, let’s look at completion percentage over expected (CPOE).
A metric invented and generated by NextGen Stats, CPOE utilizes tracking data to estimate the likelihood that a given pass is going to be completed at the exact time it is thrown. All those numbers are then averaged and then subtracted from the actual completion percentage for the game. It is argued to be one of the best examples to determine a quarterback’s overall success in the league.
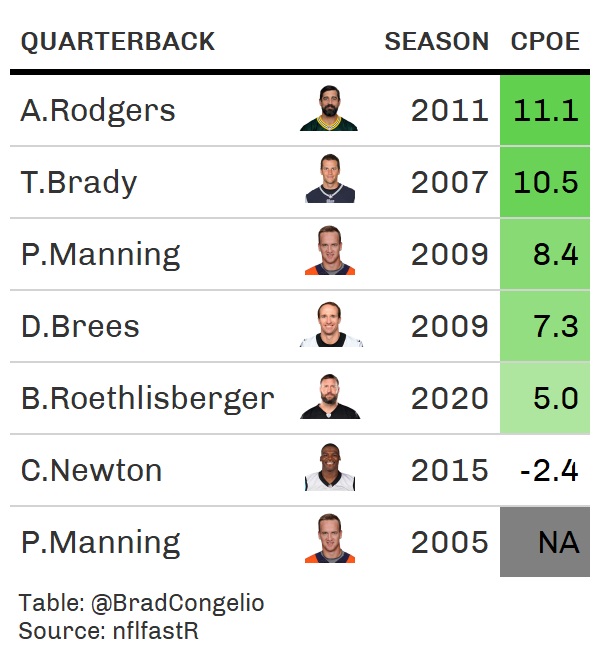
Unfortunately, Roethlisberger is failing pretty badly on this metric, with a completion percentage over expected of just 5-percent. Rodgers and Brady are well above the pack, going over 10 and 11-percent respectively.
I believe, when it comes to Roethlisberger, the verdict is this: he is getting the job done. There is no case to be made that any other quarterback on our roster could have guided the Steelers to an 11-0 record to start the 2020 campaign. He is clearly, without a doubt in my mind, the team’s MVP.
That said: when compared to the other quarterbacks to guide their squad to 11-0 since 2000, Roethlisberger pales in comparison. And that is OK.
I think most quarterbacks, ultimately, pale in comparison to Rodgers, Brady, Manning, and Brees. And as Steelers fans we should be used to Roethlisberger being overshadowed by those guys. It has always, rather inexplicably, happened.
Despite that, when defending the argument that the Steelers are not the weakest 11-0 since 2000, Roethlisberger’s stats do not help. In fact, they provide pretty solid evidence that the title for the weakest 11-0 team goes to either the Steelers or Panthers. As well, Brees doesn’t quite stack up too highly either.
But, we all know that NFL “purists” would consider any crosstalk of Brees to be blasphemy.
Indeed, Roethlisberger is getting the job done. No arguing that. He isn’t getting it done in the “sexy” or “eye-popping” fashion that other 11-0 quarterbacks have gotten it done, though.
So, for the sake of brevity, before this turns into a tome, let’s quickly look at some other units.
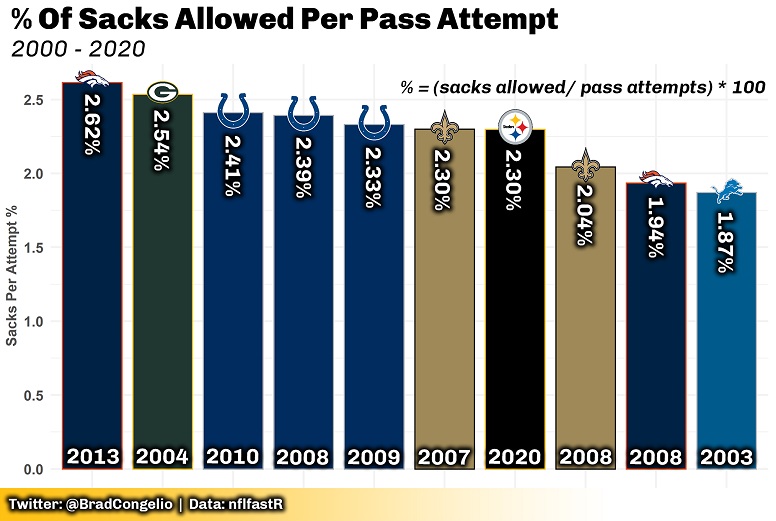
For all intents and purposes, the Steelers offensive line is providing one of the best pass-blocking performances in the NFL dating back to 2000. The line’s 2.3-percent rating in sacks allowed per pass attempt is tied for fourth-best and they are quickly sneaking up on the Saints in third place. In other words, Roethlisberger is only getting sacked on 2.3-percent of his dropbacks.
That is absolutely phenomenal.
Of course, a part of that has to do with Roethlisberger’s league-leading average time to release. But the fact remains: when the line is forced to protect Roethlisberger, they are more than capable of doing so.
Importantly: the only other 11-0 team since 2000 to show up in this metric is the 2009 Colts, who were tasked with protecting the most important, and fragile, asset the team owned: Manning.
The verdict is this: the Steelers pass blocking is historical in nature right now. Moreover, they are the best offensive line to be part of an 11-0 team since 2000.
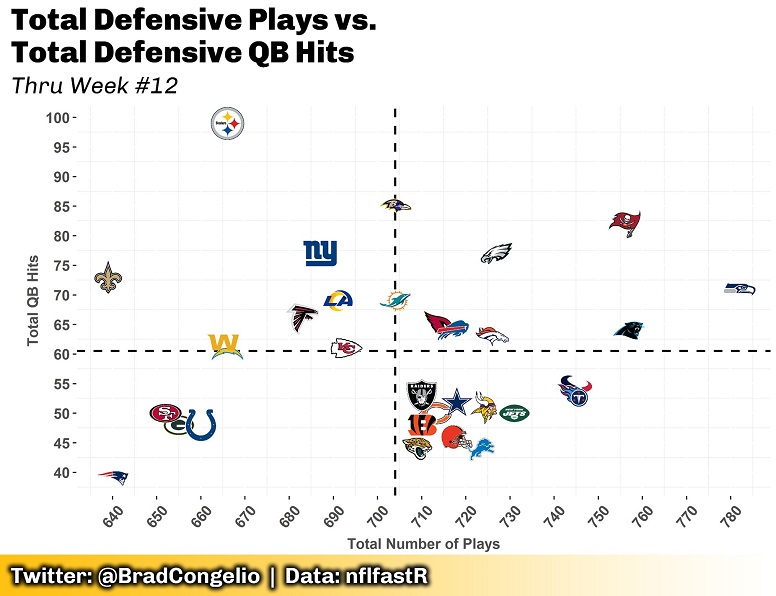
As well, the defensive unit is getting to the quarterback at a pace that is largely unheard of in the NFL. With 99 QB hits at week 12 and under 670 total defensive snaps, no other team even comes close to the Steelers.
But, how does this rank against those other 11-0 teams?
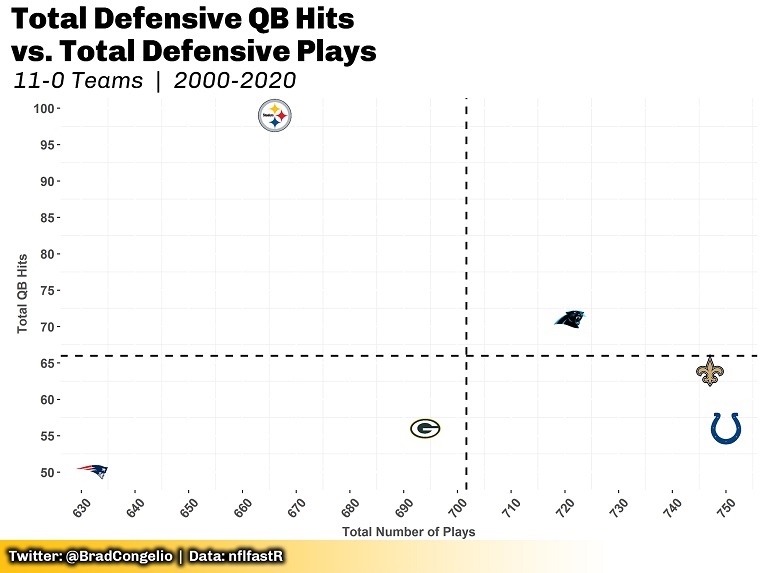
I swear I did not mess that data or visualization up.
The 2020 Steelers defense really is that far ahead in QB hits with the second-lowest total defensive snaps. There is a reason, way back in the beginning of this piece, that the 2020 Steelers were rated as having one of the strongest defenses based on EPA against all other 11-0 teams since 2000.
Of course, you do want those QB hits to ultimately turn into sacks. And the Steelers’ defensive unit has certainly responded to that charge.
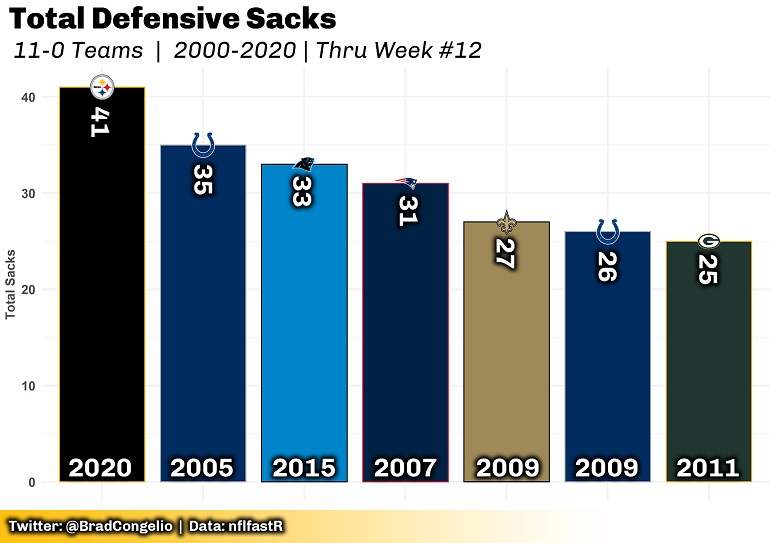
The Steelers, with 41 sacks at the week 12 point of the 2020 campaign, are well ahead of all other 11-0 teams since 2000. It is a testament to how good of a defensive unit the Steelers have right now.
Conclusion:
It truly stings to say this, but Roethlisberger simply doesn’t “stack up” well against the other quarterbacks who have led their teams to 11-0 starts. But, that is somewhat of an unfair judgement when you consider he is being compared to the likes of Rodgers, Brady, and Peyton Manning.
It is the strengths of the other units explored in part one that really make this 2020 Steelers team compare well against the other 11-0 teams.
The offensive line’s pass blocking is fantastic (we’ll explore run blocking in part two).
The defensive unit, at least at pressuring the QB and disrupting plays, is – simply – the best. As well, the 2020 unit’s defensive EPA is second only to the Panthers’ 2015 squad.
When you compare Roethlisberger to other 11-0 teams, yes, the Steelers might look weak or “overrated.”
But the strength of the offensive line and defense is more than enough to not let the team as a whole become handicapped by any perceived weakness elsewhere.
The 2020 Steelers are kind of the opposite of the 2011 Packers.
The 2011 Packers had absolutely no defense. But they did have Rodgers.
The 2020 Steelers are lacking in offensive ability, compared to the other 11-0 teams, as detailed in the overall EPA plot. But they do have that defense.
I think the real telling information will come to light when we get into the nitty gritty details of running backs and wide receivers, and that will come in part two.