All 32 teams have now played at least seven games and so with that, it’s time to check in on some ANY/A stats and start making a few predictions as it relates to which teams now have a legitimate shot at winning this year’s Super Bowl based on the history of the statistic over the course of the last 20 seasons.
If the ANY/A stat is new to you, shame on you. It’s a very important passing game statistic that can be figured for both the offense and defense. From there, a differential between a team’s offensive and defensive can be derived, and that number is useful as well. Obviously, it’s better for a team to have a higher offensive ANY/A stat than their defensive ANY/A stat. Additionally, the greater the offensive ANY/A number is more than 6.0 the better and the lesser the defensive ANY/A number is lower than 6.0 the better. A positive differential of 1.5 or greater is fantastic for a team.
ANY/A – adjusted net yards per passing attempt: (pass yards + 20*(pass TD) – 45*(interceptions thrown) – sack yards)/(passing attempts + sacks). See AY/A. Note that we are now using 20 yards per TD instead of 10, because of research by Chase Stuart at the p-f-r blog.
In the last 20 seasons, only once has a team gone on to win the Super Bowl after posting a negative ANY/A differential through seven games played. That team was the 2001 New England Patriots (-0.66).
Another ANY/A stat that sticks out for Super Bowl champion teams from the last 20 seasons is related to the defense. No team has gone on to win the Super Bowl with a defensive ANY/A stat greater than 6.19 through seven games played. Additionally, only three times in the last 20 seasons has a team gone on to win the Super Bowl after having registered a defensive ANY/A greater than 5.98 through seven games played. The Patriots did it in 2016 and 2018 and the Baltimore Ravens did it in 2012.
The offensive ANY/A stat for Super Bowl winning teams from the last 20 seasons is a lot less predictive and it has a much higher variance – 4.41 for the Ravens in 2000 through seven games played and 9.27 for the Kansas City Chiefs in 2019 through seven games played. In short, defensive ANY/A, along with ANY/A differential, is a lot more important to focus on. Besides, we all know that good pass defense is what ultimately wins championships, right?
So, now that we have the historical qualifiers out of the way, let’s apply them to this year’s stats of all 32 teams through their first seven games played this season. Below are the stats from all 32 teams ranked from best ANY/A differential to worst.
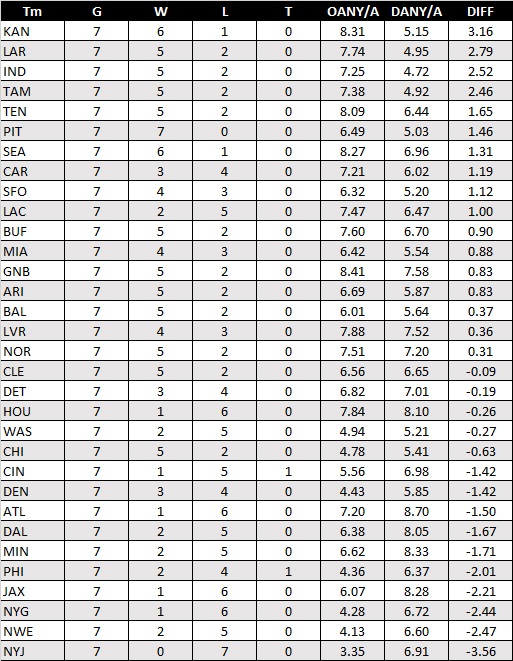
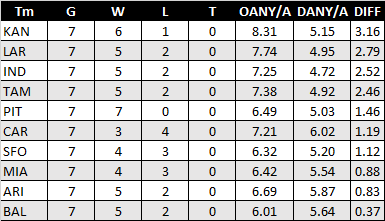
After eliminating teams with a negative differential through seven games played this season, we are left with a list of 17 teams. From there, if we are to eliminate all teams with a defensive ANY/A greater than 6.19, we are left with a list of 10 teams with the Pittsburgh Steelers being one of them. All but one of those teams had at least four wins through seven games played. All 10 also registered offensive ANY/A stats of 6.01 or greater through seven games played.
Does this stat play well with Super Bowl losing teams over the course of the last 20 seasons? Overall, yes. Only four times has a Super Bowl losing team registered a differential of lower than 0.00 through seven games played. Three of those four teams, the 2000 New York Giants (-0.35), the 2008 Arizona Cardinals (-0.33) and the 2014 Seattle Seahawks (-0.33), were close to 0.00. The one real outlier, the 2003 Carolina Panthers (-1.25), might not be matched ever again.
Is this stat now foolproof as it relates to predicting that this year’s Super Bowl game will feature two of the two teams listed above? I wouldn’t go that far, but I will be shocked if this year’s Super Bowl champion is not one of these 10 teams and likely one of the top five, of which the Steelers are fifth.