The Steel Curtain is back.
At least that is what the early statistics seem to argue about this year’s version of the Steelers defense. According to Pro Football Focus, Pittsburgh Steelers outside linebacker T.J. Watt is the top-rated defender in the league. Defensive tackle Tyson Alualu is a top-five defender as well, and defensive tackle Cameron Heyward and defensive end Chris Wormley also find a spot in PFF’s top-25 defenders.
That said, perhaps the most eye-opening statistic is the rate in which the Steelers defense is getting to quarterbacks. Even with one less game than the rest of the league because of the COVID-cancelled clash with the Tennessee Titans, the Steelers currently lead the NFL with 47 total QB hits.
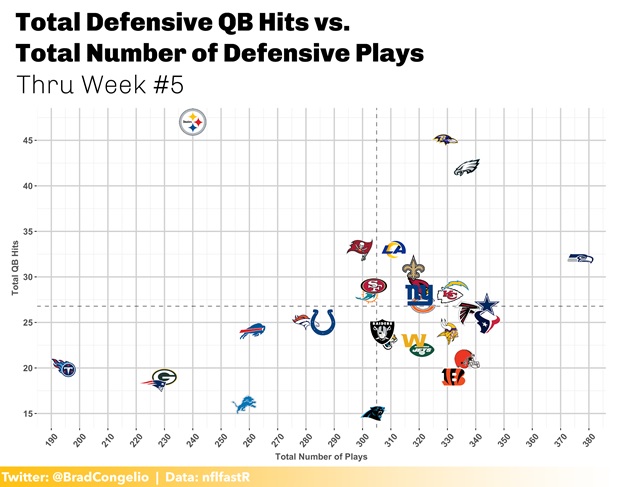
The Steelers leading the league in QB hits is even more impressive when one considers the difference in total plays because of Pittsburgh’s canceled game. For comparison, the Baltimore Ravens and Philadelphia Eagles, the two closest teams in the QB hits category, each have roughly 330 total defensive snaps.
Pittsburgh leads the league in QB hits with just 240 defensive plays run.
In other words, the Steelers have hit the opposing quarterback on roughly 20-percent of all defensive snaps. The Eagles and Ravens are doing it at about a 13-percent clip.
Not only are the Steelers leading the league in quarterback pressures, but they are doing it at an incredibly efficient rate that is 7-percent higher than the other top-three teams.
A team’s ability to pressure the quarterback, I believe, is an overlooked statistic that is an excellent measure of defensive efficiency and effectiveness. Even without recording sacks, a high number of quarterback hits throughout a game can create a cascading domino effect.
But, before going all-in on this year’s Steelers defense, we must first take into consideration the team’s schedule. Is Pittsburgh’s defensive pressure dominance perhaps a result of opponent ability? Pittsburgh’s first four opponents have only three combined wins. Further, the average pass rush blocking rating from PFF for the first four teams played is 60.2 out of 100.
At surface level, the statistics do seem to indicate that Pittsburgh’s effectiveness at disrupting offenses through pressure is a result of the quality, or lack thereof, of the offensive lines faced to this point in the season.
Because of this, and in order to get a fully-formed picture at just how good this year’s Steelers defense is at pressure, we have to create a new metric that accounts for the overall “goodness” of the opponent’s pass blocking ability. For example, getting high pressure on the Denver Broncos 48.6-rated offensive line is way less impressive than racking up the QB hits on the Houston Texans 74.9-rated offensive pass rush blocking.
While still a work in progress, the formula I have created to account for offensive line pass blocking ability is called Adjusted QB Hits over Average:
Offensive: Adj. QBHoA = sum(Avg.QBH – PIT) / PBS
Defensive: Adj. QBHoA = Hits Against Opponent / PRS
The general concept here is pretty simple.
In order to get the adjusted QB Hits over Average for Pittsburgh’s opponents, we are taking the average number of QB hits over the course of the season, being sure to subtract the ones that occurred in the game with the Steelers, then dividing that number by the team pass blocking score as provided by PFF.
To compare, the adjustment also needs to be completed for Pittsburgh. This is done by simply taking the total amount of QB hits for each specific opponent and then dividing by the overall defensive pass rush score from PFF, rather than the pass blocking score. The resulting numbers look like this:
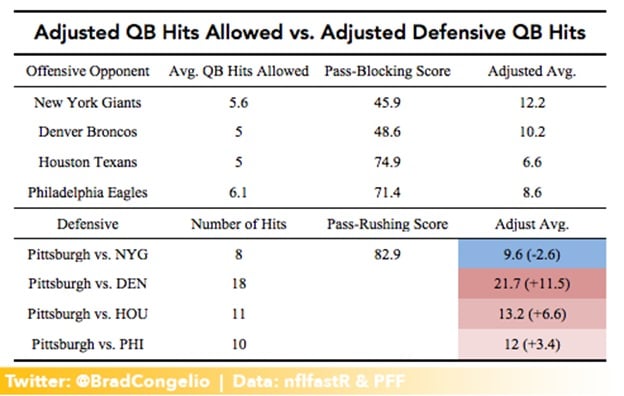
By adjusting the average QB hits for both offense and defense using pass-blocking and pass-rushing metrics from PFF allows for a better reflection of defensive ability relative to the overall opponent “goodness.”
It is important to note that the adjusted average number does not indicate a specific number of hits likely to happen. Rather, it is taking the data we already have – number of QB hits, etc. – and applying a curve to it based on the overall quality of an opponent – in this case, pass-blocking ability as rated by PFF. The end goal is not to predict numbers, but to determine if the strength and quality of opposing offensive lines thus far in the Steelers’ season influenced the team’s ability to lead the league in total QB hits.
As seen in the graph above, the Steelers – with the exception of the New York Giants season-opening tilt – are performing well above the adjusted average when playing teams with a poor pass-blocking rating. Given what we know about the Steelers defense so far, this result is not surprising.
The biggest takeaway in this example of Adjusted QB Hits over Average, in my opinion, is the Steelers’ ability to continue registering hits on the quarterbacks on those teams with high pass-blocking scores. While certainly not tops in the league in pass blocking, the Texans and Eagles are certainly no pushovers. The Texans, despite their 1-4 record, are ranked in the PFF’s top-ten pass blocking teams. The Eagles, with a record of 1-3-1, are in the top 20.
Yet, the Adjusted QB Hits over Average formula indicates that Pittsburgh will still be able to get to the opposing quarterbacks on teams that have higher-rated pass-blocking abilities.
The final outcome is this: the Steelers are likely to get to the opposing quarterback on those teams with poorly-ranked pass-blocking scores slightly above the adjusted average. After all, bad pass blocking is bad pass blocking. It is quite likely as the sample size increases throughout the rest of the season that we will see less skilled pass-rushing teams continue to “keep pace” with the Steelers against poor performing offensive lines.
However, by using the adjusted averages formula, we can make the argument that the Steelers’ league-leading QB hits number is not a result of playing poor pass-blocking teams. In fact, Pittsburgh’s adjusted average actually increased against better quality opponents.
By utilizing this metric-based “goodness” factor to curve the data, it seems that Pittsburgh’s ability to apply pressure is quite legitimate, not a result direct result of the opponent quality, and is likely to continue being a significant factor for opposing offenses to have to contend with.