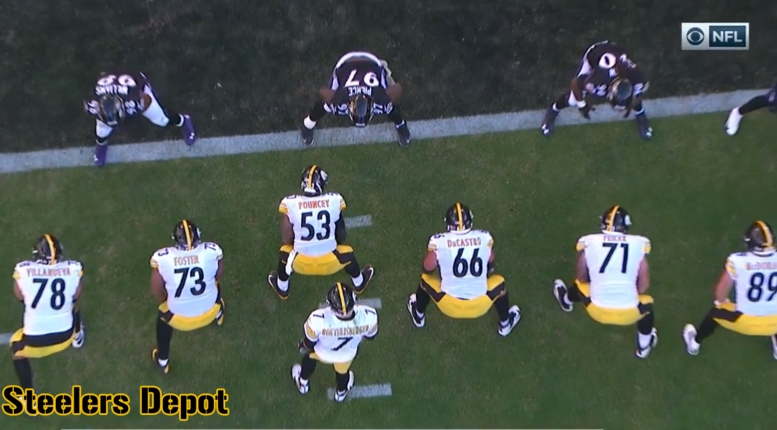
By now you should already know that the Pittsburgh Steelers lead the NFL in red zone conversion percentage through the first 10 weeks of the 2018 regular season. Their conversion percentage is an astoundingly great 78.6% as they have converted 22 of their 28 total red trips into touchdowns.
So, just how great is that rate for the Steelers at this point of the regular season? Let’s have a look at some historical data related to that stat.
Dating back to 2004, which was the rookie season for Steelers quarterback Ben Roethlisberger, the offense’s best red zone conversion percentage through the first nine regular season games of a season was previously 70.8 in 2008. The Steelers, by the way, went on to win the Super Bowl that season and it’s worth noting that the Steelers offense ended that regular season with a red zone conversion percentage of 55.1%, which was 15-best in the NFL.
By now, you’re probably curious as to what the Steelers single best red zone conversion rate has been for a regular season dating back to 2004. That number would be 60.71% and was registered twice in 2005 and again in 2015.
The best red zone conversion for a complete regular season dating back to 2004 is 76.12% and it was posted by the Denver Broncos offense in 2013. Last season, the Philadelphia Eagles ended the regular season with the highest offensive red zone conversion rate of 65.45%.
In a future post, I’ll look at red zone conversion rates and if they have any relevance in teams making it to and winning a Super Bowl.
Steelers offensive red zone conversion rates through 9 games played (2004-2018)
| YEAR | RZ CONV | RZ ATT | RATE |
|---|---|---|---|
| 2004 | 20 | 32 | 62.5% |
| 2005 | 19 | 33 | 57.6% |
| 2006 | 17 | 34 | 50.0% |
| 2007 | 21 | 35 | 60.0% |
| 2008 | 17 | 24 | 70.8% |
| 2009 | 16 | 31 | 51.6% |
| 2010 | 11 | 27 | 40.7% |
| 2011 | 14 | 30 | 46.7% |
| 2012 | 17 | 34 | 50.0% |
| 2013 | 13 | 29 | 44.8% |
| 2014 | 17 | 31 | 54.8% |
| 2015 | 18 | 28 | 64.3% |
| 2016 | 17 | 25 | 68.0% |
| 2017 | 14 | 33 | 42.4% |
| 2018 | 22 | 28 | 78.6% |


