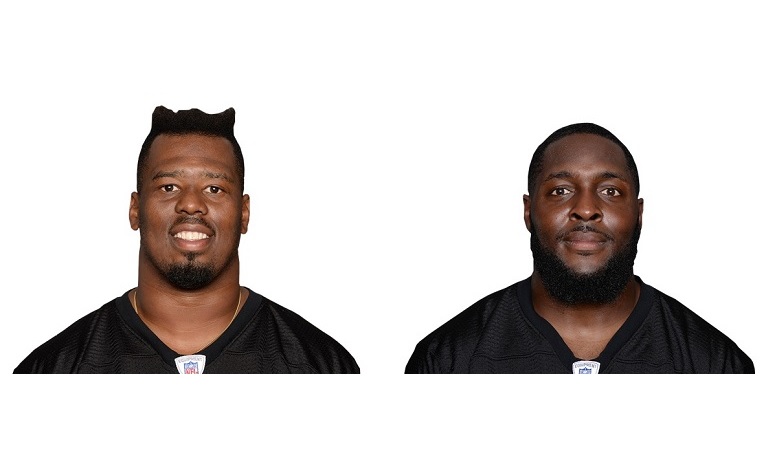
Now that Pittsburgh Steelers tackle Marcus Gilbert has been suspended for the next four games, Chris Hubbard will go back to starting on the right side once again. Hubbard, in case you didn’t already know it, has already started five games in place of an injured Gilbert this season in addition to taking over for him at right tackle in two other contests. In short, Hubbard has played the lion’s share of snaps at right tackle for the Steelers this season and roughly 60% of them to be exact.
So, how has the Steelers offense fared this season from a statistical standpoint with Hubbard and Gilbert each at right tackle? We’ll you might be surprised when you see the numbers.
As you can see in the table of stats below, the Steelers offense actually has a higher yard per carry average with Hubbard at right tackle than with Gilbert at the position. Keep in mind that these stats do not include plays negated by penalties, quarterback kneel downs, aborted plays, or quarterback scrambles. Additionally, on runs officially listed as going to either right guard, right tackle or right end, the Steelers offense has averaged 4.63 yards per carry with Hubbard at right tackle as opposed to 3.51 when Gilbert is at right tackle.
As for run success rates, Gilbert slightly edges out Hubbard in all runs. However, runs to the right side when Hubbard has been on the field instead of Gilbert have been a lot more successful.
As far as passing stats go, Steelers quarterback Ben Roethlisberger has posted a much higher completion percentage when Gilbert has been on the field at right tackle instead of Hubbard. Additionally, Roethlisberger’s touchdown to interception ratio has also been quite impressive when Gilbert has played right tackle. Two more sacks have been allowed when Gilbert has been on the field, however, but with that said, Gilbert has only allowed a half a sack this season, according to our charting, while Hubbard has allowed just one full one.
Perhaps the most noticeable and meaningful stat listed below in the eyes of some is the offense red zone efficiency. When Gilbert has been at right tackle the Steelers have converted 62.5% of their red zone trips into touchdowns as opposed to just 29.2% when Hubbard is at right tackle.
Now, I present these stats to you only because several have asked for them and while Hubbard has played seemingly well this season when you watch his tape and look at the stats related to him being in the game, I am in no way suggesting that he’s a better right tackle than Gilbert is. With that said, based on what we’ve seen so far out of Hubbard this season, fans of the team should have confidence in him continuing to fill in admirably for Gilbert over the course of the next four games.
* The stats below are pulled from our weekly offensive game charting that is done exclusively by Matthew Marczi.
| 2017 KEY OFFENSIVE STATS | ||
|---|---|---|
| RUSHING STATS | ||
| Hubbard RT | Gilbert RT | |
| YPC | 4.08 | 3.75 |
| SUCC % | 40.2% | 41.1% |
| YPC RIGHT | 4.63 | 3.51 |
| SUCC % RIGHT | 42.9% | 34.1% |
| PASSING STATS | ||
| Hubbard RT | Gilbert RT | |
| YPA | 7.53 | 6.66 |
| COMP % | 56.5% | 62.8% |
| TD | 6 | 10 |
| INT | 8 | 2 |
| SCK | 6 | 8 |
| RED ZONE EFFICIENCY | ||
| Hubbard RT | Gilbert RT | |
| CONV M/A | 7-24 | 10-16 |
| CONV % | 29.2% | 62.5% |


