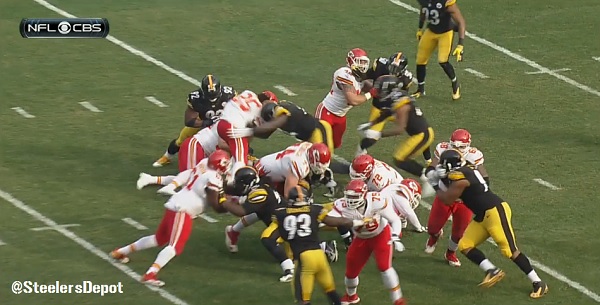
Last week, I wrote this article that had a surface level-analysis on the Pittsburgh Steelers’ defense’s ability to create splash plays. In the study, the Steelers ranked 25th in the league in tackles for loss.
Discussing it on yesterday’s The Terrible Podcast, I wanted to review it and take it another step further. If Alex Gibbs’ offensive mindset is to create splash plays (20+ yards) and limit negative ones, then a good measuring stick for defenses is how well they prevent those splash plays and create negative ones.
Before I dove in too deep, I realized I needed to clean up my first study examining tackles for losses. I was under the assumption kneel downs weren’t included in the data Pro Football Reference spit out to me. That was an incredibly dumb approach and as it turns out, kneel downs were included in the original data. Obviously, at worst, it will skew the final results or at best, provide inaccurate findings. Neither are particularly good outcomes.
I eliminated the kneel downs TFLs and subtracted all QB carries from the number of total rushes. Made the TFL category on a per carry base in order to make it relative. Then I did the same with the number of 20+ rushes allowed. Also eliminated any QB who would have qualified to keep things consistent.
The data below.
| TEAM | OPP RUSH ATT | TFL | TFL PER CARRY | RANK | 20+ RUNS | 20+ PER CARRY | RANK | OVERALL |
|---|---|---|---|---|---|---|---|---|
| SEA | 329 | 51 | 6.5 | 2 | 6 | 54.8 | 7 | 4.5 |
| OAK | 428 | 57 | 7.5 | 7 | 8 | 53.5 | 8 | 7.5 |
| DET | 317 | 51 | 6.2 | 1 | 7 | 45.3 | 15 | 8 |
| PHI | 418 | 52 | 8 | 11 | 7 | 59.7 | 5 | 8 |
| DEN | 302 | 39 | 7.7 | 10 | 6 | 50.3 | 11 | 10.5 |
| HOU | 368 | 49 | 7.5 | 7 | 8 | 46 | 14 | 10.5 |
| NYJ | 340 | 38 | 8.9 | 15 | 6 | 56.7 | 6 | 10.5 |
| BUF | 356 | 48 | 7.4 | 6 | 8 | 44.5 | 17 | 11.5 |
| TAM | 432 | 60 | 7.2 | 4 | 10 | 43.2 | 19 | 11.5 |
| ARI | 337 | 48 | 7 | 3 | 8 | 42.1 | 21 | 12 |
| CIN | 376 | 36 | 10.4 | 21 | 6 | 62.7 | 4 | 12.5 |
| GNB | 392 | 35 | 11.2 | 24 | 4 | 98 | 2 | 13 |
| NWE | 374 | 33 | 11.3 | 25 | 2 | 187 | 1 | 13 |
| TEN | 460 | 47 | 9.8 | 18 | 9 | 51.1 | 10 | 14 |
| SDG | 384 | 51 | 7.5 | 7 | 10 | 38.4 | 24 | 15.5 |
| IND | 379 | 37 | 10.2 | 19 | 8 | 47.4 | 13 | 16 |
| STL | 374 | 51 | 7.3 | 5 | 11 | 34 | 27 | 16 |
| MIN | 393 | 30 | 13.1 | 31 | 5 | 78.6 | 3 | 17 |
| BAL | 345 | 37 | 9.3 | 16 | 8 | 43.1 | 20 | 18 |
| CAR | 350 | 40 | 8.8 | 14 | 9 | 38.9 | 23 | 18.5 |
| KAN | 385 | 34 | 11.3 | 25 | 8 | 48.1 | 12 | 18.5 |
| WAS | 364 | 30 | 12.1 | 28 | 7 | 52 | 9 | 18.5 |
| JAX | 445 | 52 | 8.6 | 13 | 13 | 34.2 | 26 | 19.5 |
| CHI | 360 | 32 | 11.3 | 25 | 8 | 45 | 16 | 20.5 |
| DAL | 349 | 42 | 8.3 | 12 | 12 | 29.1 | 29 | 20.5 |
| SFO | 362 | 35 | 10.3 | 20 | 9 | 40.2 | 22 | 21 |
| ATL | 396 | 32 | 12.4 | 30 | 9 | 44 | 18 | 24 |
| NOR | 385 | 41 | 9.4 | 17 | 15 | 25.7 | 32 | 24.5 |
| PIT | 325 | 31 | 10.5 | 23 | 10 | 32.5 | 28 | 25.5 |
| MIA | 396 | 38 | 10.4 | 21 | 15 | 26.4 | 31 | 26 |
| NYG | 394 | 32 | 12.3 | 29 | 11 | 35.8 | 25 | 27 |
| CLE | 446 | 34 | 13.1 | 31 | 16 | 27.9 | 30 | 30.5 |
We’ll hone in on just the Steelers here. As you can tell, they did not fare well, finishing 29th overall. Only the Miami Dolphins, New York Giants, and Cleveland Browns managed to perform worse.
With the adjusted tackles for loss number, the Steelers finished 23rd. In terms of raw data, their 31 backfield stops was third worst only to the Minnesota Vikings and Washington Redskins, but because the defense saw fewer rushing attempts – third fewest in the league – they were bailed out. But this is a prime example of why we use the “per carry” basis instead of the whole number.
As a point of reference, the Detroit Lions who finished first in this category, would average a full TFL more per game than the Steelers, 3.2 to 1.9.
It only got worse for Pittsburgh in allowing 20+ yard runs. You could’ve expected that if you watched the season but it’s helpful to have a number attached to it. The Steelers came in 28th place, giving up a splash play once every 32.5 carries, ten times during the entire season. They were only one of ten teams to allow double-digit splash plays by running backs.
There are so many components that go into playing effective run defense but two must-areas of correction are producing splash plays while avoiding giving them up. That’s getting back to characteristic Steelers’ defense. And it’s task number one for Keith Butler.


