I wanted to take a long hard look at the Steelers redzone woes in 2010, so I used a crude successful play formula to get a better look at both the passing game and running game for the Steelers on plays inside the opponents redzone. Now defining a successful play is very tricky, but I will I tell you the criteria I used in the stats and tables below. Generally, a play is deemed as a success when the following occurs: 40% of yards‐to‐go are gained on 1st down; 60% of yards‐to‐go on 2nd down; or 100% of yards‐to‐go on 3rd & 4th down. So in other words, a pass or run play on 1st and 10 that gains 4 yards or more would be deemed a successful play for this example. On the flip side, a 3rd and 10 play that picks up only 9 yards, would be deemed as unsuccessful.
Next let me explain the headings of the first table below. The first column is the redzone TD%. That is pretty easy to understand. The Steelers for example only converted 48% of their redzone trips into touchdowns. That ranked them 23rd in the league in that category and gave many of us ulcers all year long. The second column is the number of redzone pass plays run followed by the number of successful pass plays achieved based on the above criteria I explained. That is followed by the % of successful pass plays, of total pass play inside the redzone. The next 3 columns are dedicated to the running plays inside the redzone. The number of plays first, the number of successful plays next followed by the percentage once again. The last 3 columns are the totals of both passing and running plays combined and the success rate percentage. If I have not lost you yet, let\’s take a closer look now at the stats.
The table is sorted initially by best to worst touchdown redzone percentage, but every column is sortable by clicking each heading. You will also see that I have included the 2008 & 2009 Steelers stats along with the 2010 Steelers and the other 31 teams for comparative purposes. The Steelers 2008 redzone TD percentage was the best of the last 3 regular seasons as you can see. Even with that 55% number though, they barely would have ranked in the top half of the league in 2010.
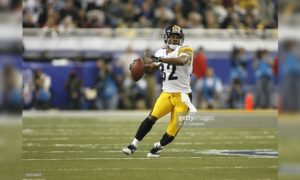
If you sort the RZPS% column, you will see that the Steelers finished with a 4th worst rate at passing successful inside the redzone. I pulled the regular season redzone passing stats for Ben Roethlisberger in 2010 and he was 29 of 56 passing inside the redzone. That equates to just 52%, pretty bad when compared to Aaron Rodgers who put up a 66% redzone completion rate and Tom Brady who put up a 63% completion rate. Just for comparison purposes, Ben had a 54% completion percentage in 2009 and a 46% redzone completion rate inside the redzone in 2008, the year they beat Arizona in the Super Bowl. Now in no way is this post pinning the redzone woes on Ben or offensive coordinator Bruce Arians as so many variables are involved. In 2010, the Steelers did not have Santonio Holmes, so that is one train of thought. Let\’s take 2009 for example. Inside the redzone Holmes was targeted 14 times and caught 6 of those balls. 4 of those were for 1st downs and 1 was a touchdown. The Steelers also had a very productive Heath Miller in 2009 as well. He was targeted 17 times in the redzone in 2009 and caught 14 of those passes. Those catches were productive in addition as 2 were for 1st downs and 6 for touchdowns. In 2010 of course the Steelers were without Holmes and Miller missed 2 full games and part of another against the Ravens due to a concussion. Now the redzone numbers that Holmes put up over the past 2 seasons prior to being traded were not earth shattering, as he caught just 10 of the 25 balls thrown at him in the redzone, but he was such a threat in short spaces with his great route running that it often demanded extra attention. Without Holmes, Hines Ward also saw his production slip in the redzone as well in 2010. As teams were just not as concerned with Mike Wallace that much in the redzone as a threat. Wallace has been targeted 17 times over the last 2 seasons inside the redzone and caught just 5 balls thrown his way. Of those 5 catches, 2 were for touchdowns and one moved the sticks. As many know, the biggest threat Wallace poises to defenses is his ability to stretch the field. He still needs to make improvement with his short area route running and getting separation. On a high note, rookie Emmanuel Sanders caught 5 of 7 balls thrown his way inside the redzone with one touchdown catch. He of course slowly worked his way up the depth chart as the number 3 wide receiver. It would not be surprising to see his role increase in 2011 and the role of Ward decrease as well. Especially on early downs.
The Steelers running game in the redzone was so-so in 2010 as you can also see in the table as they finished with a successful running play rate of 45%. As a comparison, the Packers also finished with a successful running play rate of 45% and the Jets had a 44% successful play rate. Considering how much shuffling the offensive line had in 2010, that is not a bad number in my opinion, but of course it always can be improved.
One thing that stuck out on me when looking at the success of the Patriots in the redzone success they had was how they used their two, newly drafted tight ends. Rob Gronkowski and Aaron Hernandez were both exceptional inside the redzone. They were targeted a total of 28 times by my count and caught 21 of those passes. 15 of these were for touchdowns. Combining the Patriots wide receivers and tight ends in 2010, the Patriots had 45 redzone receptions. 23 of those receptions came from the tight ends. The extra 2 coming from Alge Crumpler. That is over 50% of the redzone catches of those two positions combined. Could the Steelers be just one good tight end way from solving their redzone problems? Matt Spaeth is regarded as a blocking tight end and we saw this first hand during the first meeting against the Jets when Miller was sidelined. That makes a pretty strong argument for the Steelers perhaps drafting Wisconsin tight end Lance Kendricks somewhere around round 3 or 4. Kendricks is perhaps the best all-around tight end the draft that best matches what the Steelers need a tight end to do in their two tight end offense. He would surely be an upgrade over Spaeth. Just keep that thought filed away.
To show the discrepancy between the Steelers success rate inside and outside of the redzone, I compiled the second table to show all run and pass play success of all 32 teams outside of the redzone. The Steelers successful play rate via the pass was a cool 48%, it ranked them in the top 10 of the league using that stat. Of course with all of the big plays of 20 yards or more and the success of Roethlisberger on 3rd downs, it is not surprising. The running game of course could use some improvement as that 44% success rate needs to get better. Once again though, the Steelers line seemed to be always in flux last year.
In closing, I think Sanders and Antonio Brown will make much bigger contributions in 2011. Ward will be another year older, but should still be productive in crunch times. I also think the 2nd tight end position will be upgraded as well via the draft and if the offensive line can stay away from the injury bug, I think the redzone and execution on offense will improve dramatically.
Play Success Inside Redzone
| TEAM | RZ % | RZP | RZPS | RZPS% | RZR | RZRS | RZRS% | RZT | RZTS | RZTS |
|---|---|---|---|---|---|---|---|---|---|---|
| IND | 68% | 88 | 47 | 53% | 68 | 36 | 53% | 156 | 83 | 53% |
| DET | 64% | 84 | 38 | 45% | 39 | 21 | 54% | 123 | 59 | 48% |
| JAC | 63% | 71 | 28 | 39% | 70 | 39 | 56% | 141 | 67 | 48% |
| NE | 63% | 90 | 44 | 49% | 87 | 43 | 49% | 177 | 87 | 49% |
| HOU | 62% | 78 | 36 | 46% | 91 | 46 | 51% | 169 | 82 | 49% |
| GB | 60% | 95 | 42 | 44% | 58 | 26 | 45% | 153 | 68 | 44% |
| ATL | 60% | 96 | 38 | 40% | 106 | 46 | 43% | 202 | 84 | 42% |
| KC | 60% | 66 | 28 | 42% | 73 | 38 | 52% | 139 | 66 | 47% |
| DAL | 60% | 80 | 36 | 45% | 73 | 36 | 49% | 153 | 72 | 47% |
| TEN | 58% | 60 | 29 | 48% | 60 | 24 | 40% | 120 | 53 | 44% |
| NYG | 57% | 75 | 34 | 45% | 82 | 41 | 50% | 157 | 75 | 48% |
| SD | 56% | 82 | 35 | 43% | 75 | 45 | 60% | 157 | 80 | 51% |
| DEN | 56% | 82 | 31 | 38% | 48 | 20 | 42% | 130 | 51 | 39% |
| PIT 08 | 55% | 69 | 24 | 35% | 74 | 40 | 54% | 143 | 64 | 45% |
| PHI | 53% | 104 | 40 | 38% | 76 | 38 | 50% | 180 | 78 | 43% |
| MIA | 53% | 50 | 21 | 42% | 53 | 23 | 43% | 103 | 44 | 43% |
| TB | 52% | 62 | 32 | 52% | 56 | 22 | 39% | 118 | 54 | 46% |
| OAK | 52% | 61 | 22 | 36% | 78 | 39 | 50% | 139 | 61 | 44% |
| BUF | 51% | 65 | 26 | 40% | 46 | 22 | 48% | 111 | 48 | 43% |
| WAS | 51% | 74 | 33 | 45% | 64 | 33 | 52% | 138 | 66 | 48% |
| NO | 51% | 108 | 49 | 45% | 75 | 33 | 44% | 183 | 82 | 45% |
| CIN | 49% | 76 | 29 | 38% | 75 | 38 | 51% | 151 | 67 | 44% |
| BAL | 49% | 62 | 20 | 32% | 90 | 49 | 54% | 152 | 69 | 45% |
| PIT 09 | 48% | 80 | 33 | 41% | 63 | 27 | 43% | 143 | 60 | 42% |
| PIT | 48% | 70 | 22 | 31% | 77 | 35 | 45% | 147 | 57 | 39% |
| SF | 48% | 56 | 22 | 39% | 62 | 28 | 45% | 118 | 50 | 42% |
| CLE | 45% | 49 | 18 | 37% | 58 | 32 | 55% | 107 | 50 | 47% |
| CHI | 45% | 72 | 29 | 40% | 62 | 22 | 35% | 134 | 51 | 38% |
| MIN | 43% | 59 | 21 | 36% | 68 | 29 | 43% | 127 | 50 | 39% |
| ARI | 43% | 71 | 16 | 23% | 41 | 21 | 51% | 112 | 37 | 33% |
| SEA | 42% | 82 | 35 | 43% | 73 | 28 | 38% | 155 | 63 | 41% |
| NYJ | 40% | 75 | 22 | 29% | 63 | 28 | 44% | 138 | 50 | 36% |
| STL | 36% | 95 | 31 | 33% | 64 | 18 | 28% | 159 | 49 | 31% |
| CAR | 30% | 46 | 12 | 26% | 45 | 13 | 29% | 91 | 25 | 27% |
Play Success Rate Outside Of Redzone
| TEAM | PP | PPS | PPS% | RP | RPS | RPS% | TP | TPS | TPS% |
|---|---|---|---|---|---|---|---|---|---|
| NE | 442 | 221 | 50% | 365 | 199 | 55% | 807 | 420 | 52% |
| NO | 575 | 301 | 52% | 303 | 153 | 50% | 878 | 454 | 52% |
| IND | 607 | 328 | 54% | 323 | 146 | 45% | 930 | 474 | 51% |
| GB | 482 | 249 | 52% | 361 | 173 | 48% | 843 | 422 | 50% |
| HOU | 528 | 254 | 48% | 329 | 171 | 52% | 857 | 425 | 50% |
| PIT 09 | 506 | 260 | 51% | 364 | 169 | 46% | 870 | 429 | 49% |
| NYG | 479 | 231 | 48% | 392 | 187 | 48% | 871 | 418 | 48% |
| JAC | 434 | 190 | 44% | 439 | 228 | 52% | 873 | 418 | 48% |
| SD | 500 | 256 | 51% | 379 | 162 | 43% | 879 | 418 | 48% |
| CIN | 542 | 268 | 49% | 350 | 153 | 44% | 892 | 421 | 47% |
| NYJ | 478 | 208 | 44% | 466 | 237 | 51% | 944 | 445 | 47% |
| DAL | 529 | 242 | 46% | 346 | 170 | 49% | 875 | 412 | 47% |
| ATL | 509 | 241 | 47% | 391 | 178 | 46% | 900 | 419 | 47% |
| PIT | 451 | 218 | 48% | 391 | 173 | 44% | 842 | 391 | 46% |
| PHI | 508 | 232 | 46% | 347 | 163 | 47% | 855 | 395 | 46% |
| KC | 442 | 195 | 44% | 480 | 229 | 48% | 922 | 424 | 46% |
| BAL | 466 | 211 | 45% | 393 | 181 | 46% | 859 | 392 | 46% |
| MIA | 544 | 243 | 45% | 386 | 177 | 46% | 930 | 420 | 45% |
| MIN | 482 | 211 | 44% | 366 | 168 | 46% | 848 | 379 | 45% |
| TB | 461 | 198 | 43% | 371 | 173 | 47% | 832 | 371 | 45% |
| PIT 08 | 489 | 224 | 46% | 381 | 160 | 42% | 870 | 384 | 44% |
| CLE | 464 | 193 | 42% | 353 | 162 | 46% | 817 | 355 | 43% |
| SEA | 567 | 244 | 43% | 343 | 150 | 44% | 910 | 394 | 43% |
| STL | 528 | 231 | 44% | 363 | 153 | 42% | 891 | 384 | 43% |
| SF | 488 | 193 | 40% | 333 | 156 | 47% | 821 | 349 | 43% |
| WAS | 580 | 245 | 42% | 283 | 121 | 43% | 863 | 366 | 42% |
| DET | 580 | 252 | 43% | 361 | 146 | 40% | 941 | 398 | 42% |
| CHI | 449 | 193 | 43% | 352 | 144 | 41% | 801 | 337 | 42% |
| BUF | 486 | 193 | 40% | 351 | 159 | 45% | 837 | 352 | 42% |
| DEN | 538 | 231 | 43% | 344 | 138 | 40% | 882 | 369 | 42% |
| OAK | 475 | 190 | 40% | 420 | 179 | 43% | 895 | 369 | 41% |
| TEN | 442 | 179 | 40% | 341 | 131 | 38% | 783 | 310 | 40% |
| ARI | 539 | 202 | 37% | 275 | 120 | 44% | 814 | 322 | 40% |
| CAR | 486 | 167 | 34% | 372 | 134 | 36% | 858 | 301 | 35% |