The Pittsburgh Steelers had a busy free agency, including the signing of Chandon Sullivan. With OTA’s underway, we got news that Sullivan got first-team reps in the slot and as a nickel defender, a position that’s a big question mark for the 2023 Pittsburgh Steelers. So, it seemed like an appropriate time to provide some data context from his time with the Vikings last year, along with Patrick Peterson who was also signed from Minnesota this offseason, and the 2022 Steelers cornerbacks with substantial targets (30 or more) to get a gauge of the loss/gains from a stats perspective. Here is a coverage article I did earlier this offseason, so revisit that if you want more takeaways on the other cornerbacks as we focus on Sullivan.
Let’s get right to it, starting with 2022 coverage snaps and targets for quantity value:
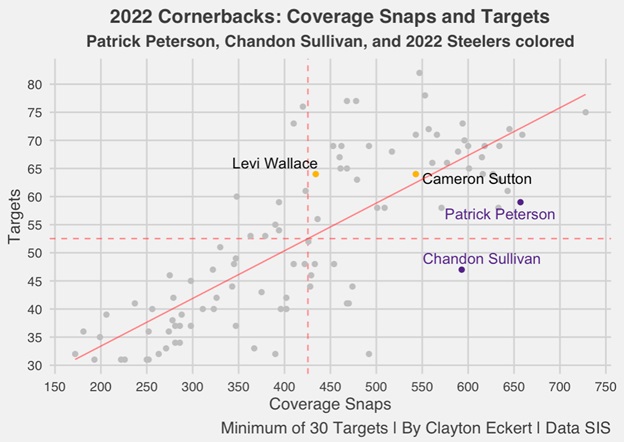
Sullivan played every game for the Vikings last year and provided substantial coverage snaps (593), which ranked 17th overall out of the 101 qualifying corners, and second most of the players in our sights today. He was the only highlighted player below the mean in targets with 47, which was a very low rate landing by himself on the bottom right of the chart. This is likely due to the amount of zone he played in with Minnesota, and here are their 2022 coverage scheme rates from PFF for comparative context:
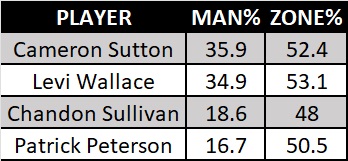
Here we can see the difference in man percentages from the Vikings compared to Pittsburgh, extremely low rates to what Pittsburgh will seemingly ask of them. This is a very notable element to play that will be interesting to monitor in 2023 as they begin their journey in the black and gold, and very important to factor in as we continue with the data.
Now let’s begin to examine the quality of play with completion percentage and deserved catch percentage, which is the number of completions and drops divided by the number of catchable targets and passes defensed:
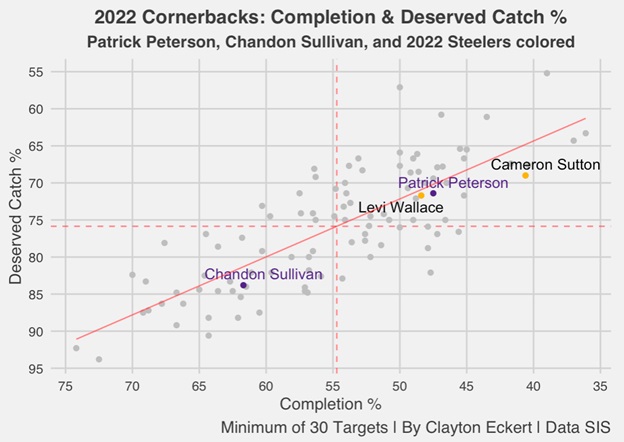
Here we can see a stark difference in Sullivan’s 2022 campaign, with the only below the mean result through Steelers’ lenses. He allowed a 61.7 completion rate (78th) and an 83.8 deserved catch percentage that ranked 81st among the qualifying cornerbacks. This is a concerning element if he is able to earn a role with Pittsburgh in 2023, especially considering the slot position is where the vast majority of his snaps came in the sample of data, and where his opportunities would likely come considering the plethora of outside corners at Pittsburgh’s disposal.
Next, let’s look at the depth of targets with yards per attempt and yards per coverage snap:
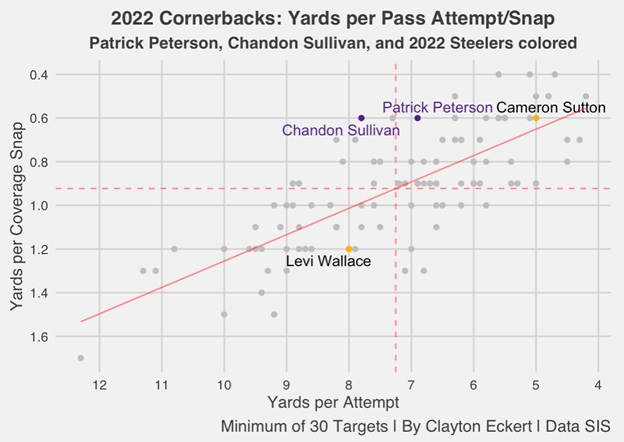
Here we see the former Vikings benefitted from their high rate of zone coverage, keeping plays in front of them and being able to limit yards per coverage snap well above league average last season. Sullivan had a below-the-mean 7.8 yards per attempt though (T-63rd), which is a bit concerning with the stacked wide receiver corps in the division and across the NFL. It’s also important to account for this yardage coming from the slot compared to Cameron Sutton’s strong result, the large quality and substantial slot snaps Pittsburgh is looking to replace. Definitely something that will be important to monitor, regardless of who earns this role.
Another stat that is used often to evaluate defenders in coverage is QBR Against, so let’s see how they fare along with Wins Above Replacement (WAR), which is a points above replacement scale conversion that is based on the scoring environment:
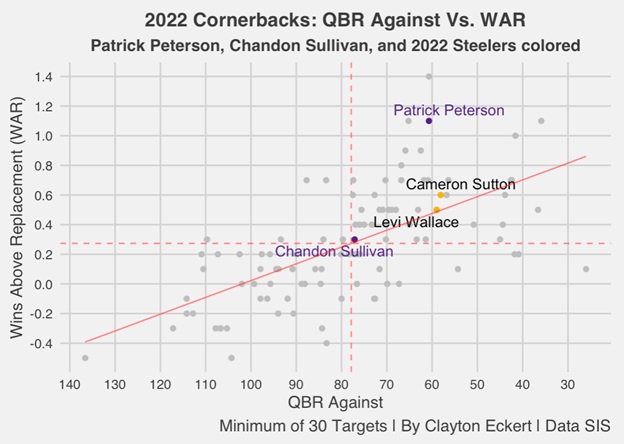
Sullivan lands at the bottom of the players in our sights today, but a more average result league-wide at the mean in both data points. He had a 77.1 QBR Against that ranked 53rd, along with tying for 41st in WAR. He encouragingly was not charted for allowing a touchdown last year, but also had a goose egg in the interception column, notably with two dropped opportunities. Hopefully, that is something he can clean of with Pittsburgh, hence providing a bigger impact in game-changing situations.
To close, let’s look more at these types of situations with boom-and-bust percentages from SIS to see how the cornerbacks performed on extreme end of the spectrum plays:
- Boom % = The percentage of dropbacks that resulted in an Expected Points Added (EPA) of 1 or more (a very successful play for the offense)
- Bust % = The percentage of dropbacks that resulted in an EPA of -1 or less (a very unsuccessful play for the offense)
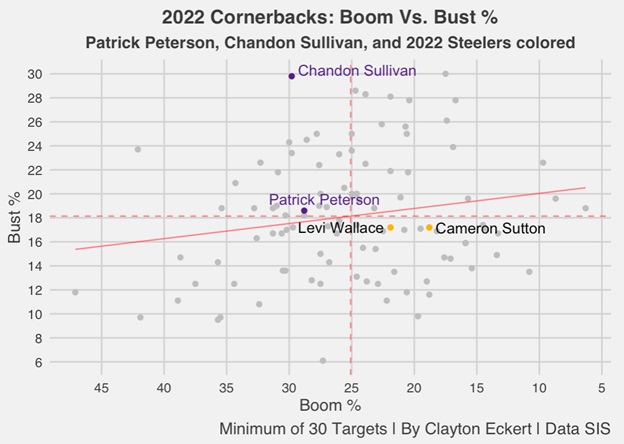
Here we see when Sullivan was in coverage for Minnesota last year, he had an encouragingly high second-ranked 29.8 bust percentage, meaning there were many highly unsuccessful offensive plays in his opportunities. His boom percentage was below average though, tying for 74th in allowing extremely successful offensive plays, which was another aspect in his 2022 season that he fared the worst in of our focused players.
Regarding the data and outlook for 2023, Sullivan’s best result by far was his second-ranked bust rate, with above-average marks in coverage snaps, yards per coverage snap, along with a low target/snap ratio considering the amount of zone he played, which is a concerning transition for him in a Steelers uniform. He was at league average in QBR Against and WAR, and his below-league mean results came in completion and deserved catch rates, yards per attempt, and boom percentage. Another concern was his low rate of man coverage, a less-than-ideal projection of how he (and Peterson) will fare in Pittsburgh, who have played much heavier man coverage schemes. There are no doubt many questions that will have to wait for answers, and I can’t wait to see how it all pans out.
What are your thoughts on the data and the position group for the 2023 season? Thanks for reading and let me know your thoughts in the comments.