With the week three game in the books, it’s time to provide my quarterback passing locations charting for the game and the regular season thus far. In case you missed the previous articles, I will be charting, visualizing, and providing takeaways for the all-important quarterback position for the Pittsburgh Steelers. Thanks to Thomas Mock for his great article that helped me learn much of what I’m using today. Couple notes before we jump in. All yardage referenced are air yards from the line of scrimmage and bats at the line of scrimmage, spikes, and clear throwaways removed. Quarterback Mitch Trubisky went 20/32 on the stat sheet with no touchdowns or interceptions. One of these passes was removed for the sake of this charting: a throwaway out of bounds.
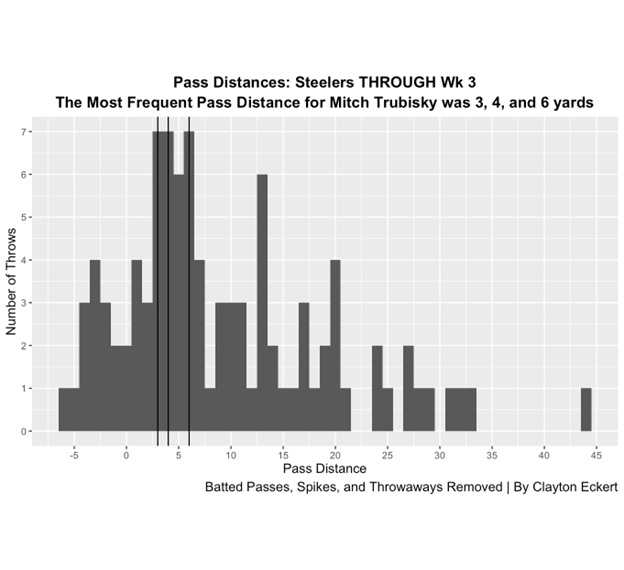
Let’s start with a simple view of the 31 passes with number of throws and pass distances for week three:
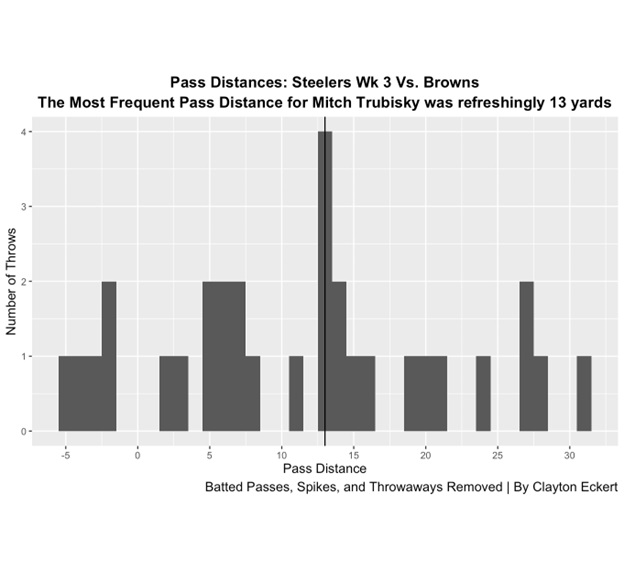
Right away we see a big change in the pass distances for week three, with four passes traveling 13 air yards. This was something I wrote about hoping to see, considering the intermediate area of 10-15 yards being hit only 12.1% of the time through two weeks. For week three, a whopping 25.8% of passes went to this range for the most common pass distance of the week! Another very encouraging element was explosive attempts, with 22.6% of them having explosive air yards. More on that in a bit. 5-10 yard passes tied for the second most frequent with explosives. 16.1% of passes came behind the line and 12.9% from 0-5 yards. The least frequent pass distance for week three was 15-20 yards at 12.9%, an area I would like to see Trubisky exploit more though we saw it a bit more than week two.
Here are the dots and heat maps of completions and incompletions for week three:
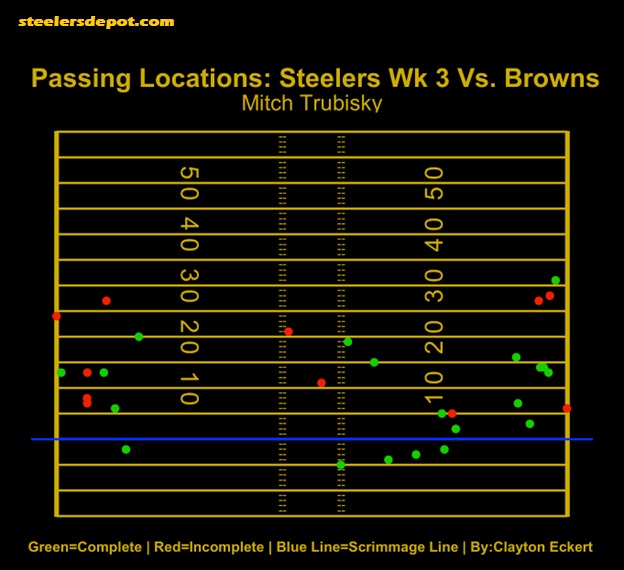
Here we get more context to the pass distances with the areas of the field Trubisky targeted. He favored the right side of the field, especially in the first half with 10/13 of his throws and was efficient overall including eight straight completions. All of his passes to the left were interestingly outside the numbers, with no passes in a large area on the left side. Trubisky was successful on short passes/dumpoffs to the right, going 6/7 from the right hash to just outside the numbers. Seven of his throws were explosive in air yards, but only two of them were completed, with one of them being a refreshing pass where only George Pickens could make the play, and boy did he with the amazing highlight catch with 31 explosive air yards and the longest pass distance of the season. Encouragingly more variety in pass distances than last week that hopefully continues.
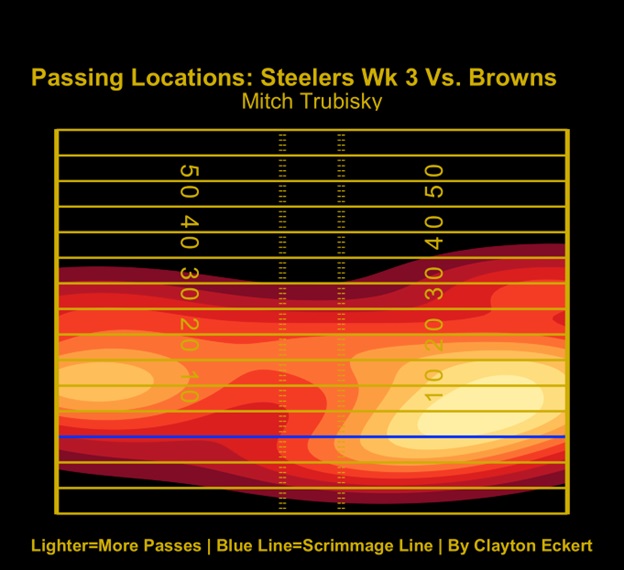
This heat map really helps me highlight the earlier point, and if you’ve been following the articles can especially see a wider range of passes (lighter colors) in the intermediate (10-20 yard) range than the first two weeks. The middle of the field is another area that will be interesting to monitor, and while I’m not expecting to see a huge jump in that regard, looking forward to a hopeful positive trend moving forward.
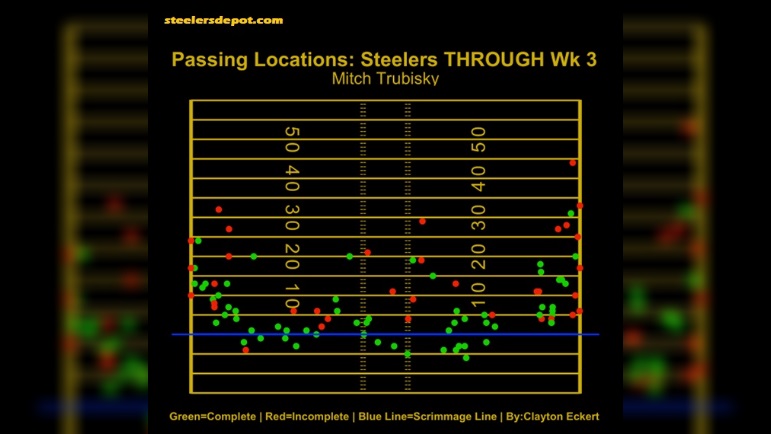
Now let’s look at the total number of throws and pass distances for the 97 charted throws throughout the regular season:
As I stated earlier, we saw more variety of pass distances against the Browns in week three. Looking at the numbers, 29.9% of passes last game were 0-5 yards, which is still the most common pass distance for Pittsburgh, but down from a high 37.8% in the first two games. This is especially encouraging on a short week, and hope we see similar splits moving forward as the sample size grows. The second most common distance through the season thus far is 5-10 yards (24.7%). 16.5% 10-15 yards, which is also tied with explosive attempts. Passes behind the line of scrimmage have occurred 14.4%, along with 15-20 yard passes being the least common pass distance. So, the rate of passes generally have decreased the further you get away from the line of scrimmage (as one would expect), with behind the line and 15-20 yard passes being the exception and at the lowest rate. The latter will be highest on my radar moving forward.
Here’s are the dots for all regular season passes:
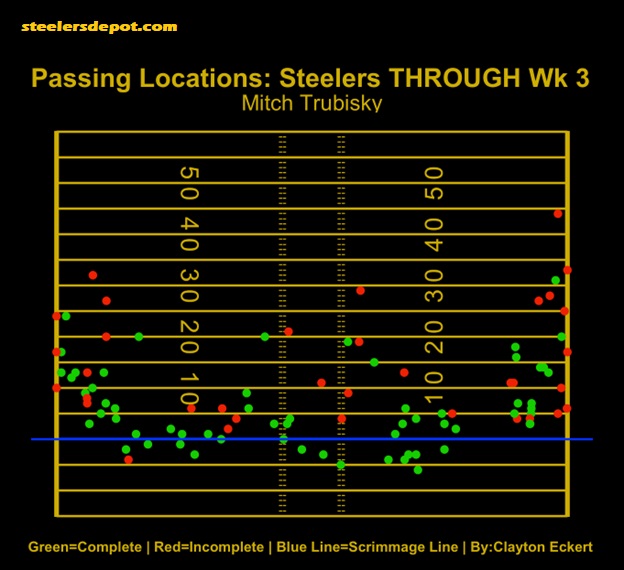
Even though this is still a small sample size, we continue to get great context and takeaways as we add data to what has transpired so far this season. Looking at areas where incompletions have come, the right sideline is an area with a low conversion rate, along with explosives in general with most of them coming outside the numbers. Also, would like to see more connection when Trubisky’s downfield middle connection improve, considering the well documented low number of attempts there. The total lack of passes ten or more yards on/around the numbers is staggering, and hoping to see more variance in the route schemes to give defenses more field to cover. Trubisky has been very efficient around the line of scrimmage, especially from the left hash to the right numbers, and also five yards or less from the numbers to the sideline.
To close, here is a heat map viewing Trubisky’s 62 completions only for the first three games:
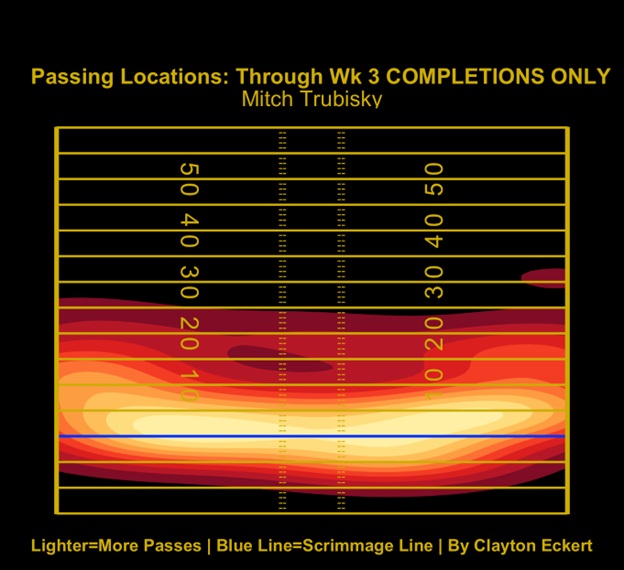
The increased intermediate passing along with more passes in the sample size makes for a much more colorful chart than last week. The most common completion area is 0-5 yards on either side of the hashes to slightly outside the numbers, with a bit more distance to the right. Left intermediate is another area of success thus far for Trubisky. We did see the most explosive attempts in week three (seven), compared to three in week two, and six in the opener. In my opinion, the seven explosive attempts feels like a good number to hover for Pittsburgh and Trubisky, focusing on the connection rather than just going Uncle Rico for the sake of it.
What are your thoughts on the charting and how Trubisky fared in week three? How about the season thus far? Thanks for reading and let me know your thoughts in the comments!