Continuing with the second article of the series, I wanted to look at and provide more context for the position in their final season using Sports Info Solutions (SIS). Similar to the first study I’m focusing on players selected in the 2022 NFL draft, and a few players were excluded due to SIS not tracking smaller school players. This time around I’ll key in on players with larger sample sizes. The goal for today is to see how Calvin Austin III stacked up to his peers last season, while continuing that focus for the next article with George Pickens included when he saw more action in the 2020 season.
Diving deeper today, let’s start with on target catch percentage (total receptions/number of catchable targets) which highlights the quality of targets and connectivity along with drop percentage (drops/catchable targets) to see who made the most of their expected catch situations:
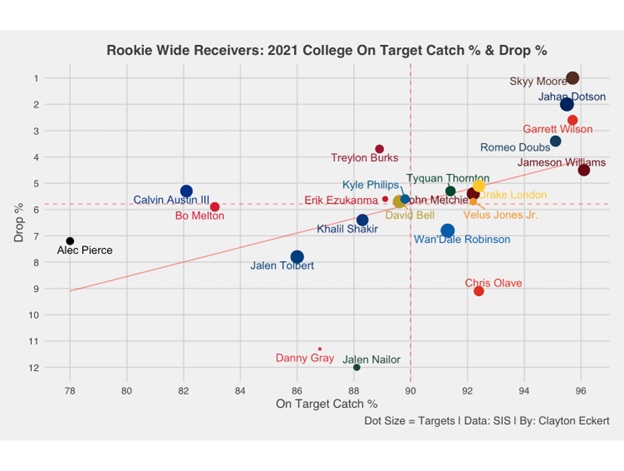
Right away we can see Austin III has the second lowest on target catch percentage of the 22 players on the graph. He did land above the mean in drop percentage, so the data supports some things we’ve heard and seen on tape. With his smaller frame, defensive backs can get to the ball more easily for pass breakups on these opportunities. Austin III also has the ability to make catches outside his frame, which was also highlighted in his draft profile. The data seems to support this with his stronger overall drop percentage result. It will be interesting to see how Pittsburgh chooses to utilize Austin III, to what extent, and if they can maximize his skillset as a separator and route runner to hopefully set him up with ideal opportunities as a rookie.
Speaking of routes, let’s look at yards per route run (total receiving yards/number of routes run excluding RPO handoffs) and yards per target (receiving yards per pass attempt in which the receiver is targeted, including incompletions) to get an idea of how the wide receivers were utilized:
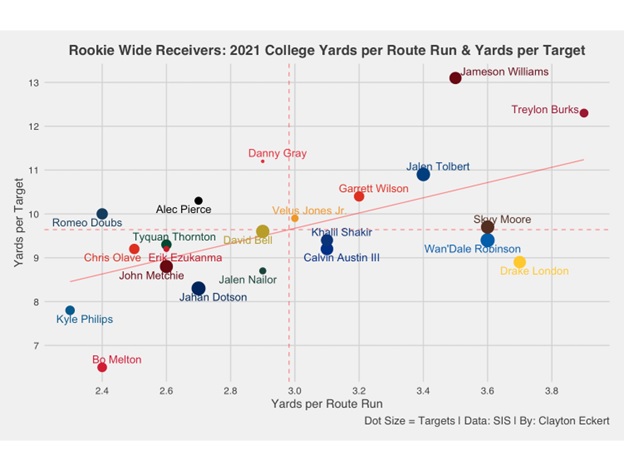
Austin III lands above the mean and tied for the eighth highest yards per route run, emphasizing his usage as a true wide receiver as opposed to a ‘gadget guy’ that some people peg him as. It is interesting to see him land just below the mean in yards per target, though with a respectable number considering his number of targets and usage in all areas of the field.
Let’s further examine wide receiver usage with average depth of target (average distance downfield that the targeted throws traveled, excluding spikes and throwaways) and average depth of completion:

In regards to average depth of target, Austin III again ranks eighth as he did in yards per route. He also fared well with a tenth rank in average depth of completion, but important to note the nearly two yard drop off compared to the top seven. Austin III does land above the mean in both data points which is very encouraging and continued context from earlier, especially seeing a high number of players land on the bottom left of the graph.
Continuing with more important factors, here are the wide receivers first down percentages (percentage of receptions where the receiver achieved a first down) along with broken + missed tackles per reception, a fun and telling data point. The goal here is to see who provided moving the chains plays and which players showed the ability to make guys miss:
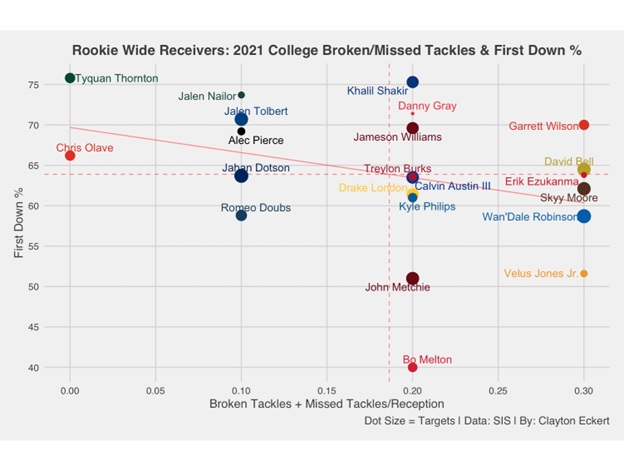
Here we see very encouraging results for Austin III, with a strong second tier result in broken + missed tackles along with being just below the mean in first down percentage. Here’s to hoping he can continue this value for Pittsburgh, which could prove valuable from the slot position as many project is his main path to playing time, and considering the many stalled drives we saw in 2021.
Here is a similar view to the first study, viewing the wide receivers completed air yard percentage (CAY% = completed air yards/intended air yards) to gain context of opportunity and connectivity along with a and yards after catch percentage (YAC% = yards after catch/total yards) to see what wide receivers created once the ball was in their hands. This gives us great context of what the players provided for their team and how they were used, along with seeing who fared better in their final season:
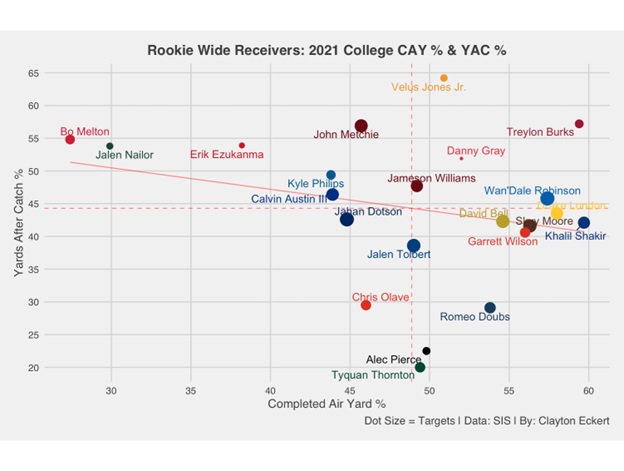
The stronger result for Austin III last season was YAC%, with a healthy improvement from 2020 of over 10% that I highlighted in the first study. Looking at the 2021 results above, he ranked 10th amongst his peers which continues to give more total context to creating with the ball in his hands as mentioned earlier. He had similar CAY% in each of the last two seasons, which is the other side of the coin with him ranking towards the bottom of my studies thus far.
To close I wanted to provide a total value view using points earned per route (The total of a player’s EPA responsibility on routes run using the total points system that distributes credit among all players on the field for a given play. Totals are scaled up to map to the average points scored or allowed on a team level, with the player’s snap count determining how much to adjust. For receivers, this includes accounting for offensive line play, off-target passes, dropped passes, and broken tackles. Values are modulated using a quality-of-competition multiplier based on each opponent’s previous year of performance) and EPA per target (the total change in the offense’s expected points that came on passes thrown to the player):
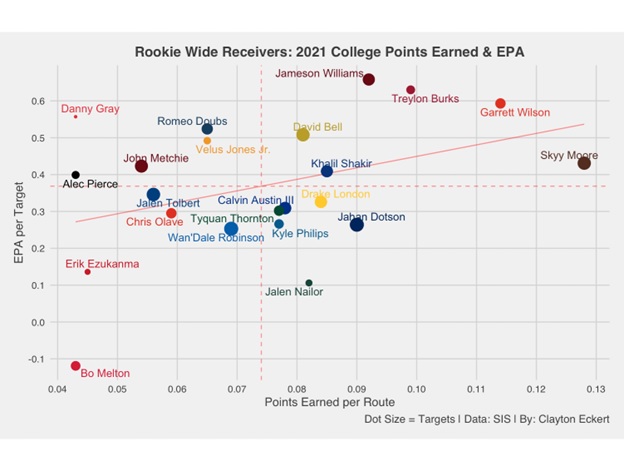
The players that have very strong results in both data points are Alabama’s Jameson Williams (Lions), Arkansas’ Treylon Burks (Titans), Ohio State’s Garrett Wilson (Jets), and Western Michigan’s Skyy Moore (Chiefs). Austin III fared better in the points earned per route data point, with the 10th rank. His EPA per target was below the mean and closely clumped with several players in that range.
Overall, Austin III fared the best in drop percentage, yards per route run, average depth of target and completion, broken + missed tackles per reception, yards after catch percentage, and points earned per route. He had lower marks in on target catch percentage, yards per target, CAY %, and EPA per target. While he didn’t top the charts in any way, he was above average in many aspects of the study. There were fewer data points of concern, but very important factors to monitor moving forward, with on target catch percentage being highest on my radar.
Throughout the rest of the offseason, I will dive deeper into the data as we continue to learn about the newest Pittsburgh Steelers. How do you think Calvin Austin III will fare in his rookie year? What are some of your takeaways across the league? Thanks for reading and let me know your thoughts in the comments!