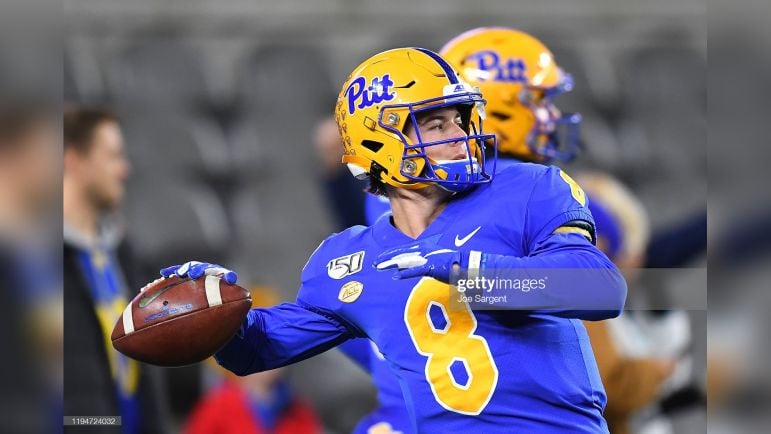
The Pittsburgh Steelers selected quarterback Kenny Pickett in the first round of the 2022 NFL Draft and since then, general manager Kevin Colbert and head coach Mike Tomlin have both talked quite a bit about the new player. Specifically, Colbert and Tomlin have praised Pickett’s accuracy in college as being one of the several traits that made the former University of Pittsburgh quarterback attractive to them. With Pickett’s accuracy being highlighted by both Colbert and Tomlin since Pickett was selected in the first round, I thought this week would be a great time to dive into some of his career passing stats.
For today’s deep stat dive, I decided to look at Pickett’s career college accuracy on passes 10-19 and passes 20 or more yards. Additionally, and because Pittsburgh had a high number of drops while Pickett was the starter there, looking at the quarterbacks adjusted completion percentage seems very necessary.
What is an adjusted completion percentage? According to Pro Football Focus, an adjusted completion percentage metric is a better way of looking at a quarterback’s overall accuracy at its baseline. Adjusted completion percentage takes into account factors outside of the quarterback’s control in terms of completing passes. It accounts for dropped passes, passes thrown away, spiked balls, passes batted at the line of scrimmage and those passes in which a quarterback was hit as he threw. Ultimately, this gives a real indication of completion percentage on passes that can actually be caught, as opposed to a quarterback’s completion percentage for a given game being tarnished by a load of receiver drops or other factors.
With that definition out of the way and with our pass depths defined, below are the career adjusted completion percentages for several college quarterbacks. This list of quarterbacks includes former first and second round draft picks in addition to the five top quarterbacks in the 2022 draft class. The other two Steelers quarterbacks currently under contract, Mitchell Trubisky and Mason Rudolph, are also included in this list.
The purpose of adding so many different quarterbacks is obviously meant to provide some overall context for these stats.
As you can see below, Pickett registered an adjusted completion percentage of 64.2% on throws of 10-19 yards past the line of scrimmage during his college career. Coincidently, he is ranked right between Trubisky and Rudolph in that stat. All three of the Steelers quarterbacks rank right ahead Trevor Lawrence and Josh Allen. That should provide more than enough context.
As for throws of 20 yards or longer, Pickett’s adjusted completion percentage of 45.5% is more than respectable and especially considering that it ranks him ahead of past first round quarterbacks, Justin Herbert, and Allen. While Pickett’s aDOT (average depth of target) of 29.3 is third lowest on this list, it’s just 1.3 yards from being in the middle of the pack. His 17 drops also stick out just like his 34 drops in the 10–19-yard table.
Now, these are just raw stats from two sets of passing distances with the main focus of them being adjusted completion percentage. While the attempt is to provide some context with these stats, they still lack more context such as down and distance, area of field, difficulty of opponent and score of game. These stats are just a 30,000-foot look, if you will, so read into them what you will. I consider it a starting point.
All stats courtesy of PFF:
| College Career Throws 10-19 Yards | ||||||||||||
|---|---|---|---|---|---|---|---|---|---|---|---|---|
| PLAYER | COLLEGE | ATT | COMP | YARDS | TD | INT | DROPS | YPA | COMP% | ADJCOMP% | RATING | ADOT |
| Justin Fields | OSU | 149 | 108 | 1659 | 23 | 4 | 8 | 11.1 | 72.5% | 77.9% | 137.3 | 13.7 |
| Mac Jones | ALA | 134 | 95 | 1898 | 17 | 2 | 8 | 14.2 | 70.9% | 76.9% | 146.6 | 13.7 |
| Baker Mayfield | OKLA | 299 | 197 | 3291 | 38 | 9 | 28 | 11.0 | 65.9% | 75.3% | 129.9 | 13.2 |
| Kyler Murray | OKLA | 135 | 87 | 1558 | 19 | 1 | 11 | 11.5 | 64.4% | 72.6% | 140.4 | 13.3 |
| Matt Corral | OLE | 215 | 130 | 2452 | 16 | 6 | 19 | 11.4 | 60.5% | 69.3% | 113.2 | 13.5 |
| Jalen Hurts | OKLA | 232 | 145 | 2627 | 24 | 8 | 15 | 11.3 | 62.5% | 69.0% | 121.5 | 13.9 |
| Zach Wilson | BYU | 236 | 145 | 2421 | 14 | 5 | 17 | 10.3 | 61.4% | 68.6% | 107.0 | 13.7 |
| Sam Howell | UNC | 272 | 163 | 2957 | 23 | 4 | 22 | 10.9 | 59.9% | 68.0% | 119.4 | 13.1 |
| Josh Rosen | UCLA | 263 | 159 | 2914 | 20 | 7 | 17 | 11.1 | 60.5% | 66.9% | 112.9 | 14.0 |
| Joe Burrow | LSU | 210 | 126 | 2330 | 20 | 5 | 14 | 11.1 | 60.0% | 66.7% | 120.1 | 13.6 |
| Lamar Jackson | LOU | 233 | 135 | 2315 | 20 | 6 | 19 | 9.9 | 57.9% | 66.1% | 109.6 | 13.6 |
| Kyle Trask | FLA | 217 | 130 | 2215 | 15 | 9 | 13 | 10.2 | 59.9% | 65.9% | 100.3 | 13.7 |
| Justin Herbert | ORE | 286 | 156 | 2750 | 27 | 12 | 32 | 9.6 | 54.6% | 65.7% | 101.6 | 13.9 |
| Dwayne Haskins | OSU | 112 | 68 | 1185 | 15 | 4 | 5 | 10.6 | 60.7% | 65.2% | 121.5 | 13.8 |
| Tua Tagovailoa | ALA | 175 | 107 | 2129 | 29 | 5 | 7 | 12.2 | 61.1% | 65.1% | 131.4 | 14.1 |
| Mitchell Trubisky | UNC | 147 | 91 | 1587 | 13 | 5 | 4 | 10.8 | 61.9% | 64.6% | 114.0 | 13.3 |
| Kenny Pickett | PITT | 352 | 192 | 3218 | 18 | 7 | 34 | 9.1 | 54.6% | 64.2% | 94.4 | 13.8 |
| Mason Rudolph | OKST | 431 | 252 | 4318 | 24 | 10 | 24 | 10.0 | 58.5% | 64.0% | 101.4 | 13.3 |
| Trevor Lawrence | CLEM | 286 | 164 | 3016 | 31 | 5 | 18 | 10.6 | 57.3% | 63.6% | 122.7 | 14.0 |
| Josh Allen | WYOM | 158 | 90 | 1506 | 13 | 10 | 8 | 9.5 | 57.0% | 62.0% | 90.3 | 13.9 |
| Sam Darnold | USC | 187 | 108 | 1798 | 17 | 10 | 7 | 9.6 | 57.8% | 61.5% | 98.3 | 13.7 |
| Jordan Love | UTST | 229 | 125 | 2011 | 18 | 8 | 15 | 8.8 | 54.6% | 61.1% | 95.8 | 13.4 |
| Desmond Ridder | CIN | 245 | 134 | 2244 | 22 | 12 | 14 | 9.2 | 54.7% | 60.4% | 95.3 | 14.0 |
| Drew Lock | MIZZ | 328 | 164 | 2989 | 38 | 10 | 32 | 9.1 | 50.0% | 59.8% | 107.6 | 13.8 |
| Daniel Jones | DUKE | 236 | 124 | 2257 | 13 | 8 | 16 | 9.6 | 52.5% | 59.3% | 90.0 | 13.4 |
| Trey Lance | NDSU | 86 | 49 | 865 | 10 | 0 | 2 | 10.1 | 57.0% | 59.3% | 130.2 | 13.7 |
| Malik Willis | LIB | 135 | 71 | 1184 | 11 | 8 | 6 | 8.8 | 52.6% | 57.0% | 84.9 | 13.4 |
| College Career Throws 20+ Yards | ||||||||||||
|---|---|---|---|---|---|---|---|---|---|---|---|---|
| PLAYER | COLLEGE | ATT | COMP | YARDS | TD | INT | DROPS | YPA | COMP% | ADJCOMP% | RATING | ADOT |
| Mac Jones | ALA | 77 | 43 | 1732 | 22 | 2 | 5 | 22.5 | 55.8% | 62.3% | 129.5 | 32.4 |
| Baker Mayfield | OKLA | 200 | 102 | 4103 | 43 | 4 | 14 | 20.5 | 51.0% | 58.0% | 127.9 | 31.3 |
| Tua Tagovailoa | ALA | 109 | 57 | 2125 | 29 | 4 | 6 | 19.5 | 52.3% | 57.8% | 122.0 | 29.8 |
| Zach Wilson | BYU | 129 | 65 | 2273 | 19 | 6 | 5 | 17.6 | 50.4% | 54.3% | 116.4 | 30.0 |
| Kyle Trask | FLA | 115 | 57 | 1813 | 23 | 3 | 5 | 15.8 | 49.6% | 53.9% | 124.2 | 28.6 |
| Mason Rudolph | OKST | 288 | 138 | 5249 | 48 | 8 | 16 | 18.2 | 47.9% | 53.5% | 122.1 | 31.0 |
| Joe Burrow | LSU | 149 | 73 | 2592 | 37 | 4 | 6 | 17.4 | 49.0% | 53.0% | 123.4 | 29.8 |
| Justin Fields | OSU | 117 | 57 | 1856 | 30 | 4 | 4 | 15.9 | 48.7% | 52.1% | 120.1 | 31.9 |
| Dwayne Haskins | OSU | 78 | 36 | 1209 | 19 | 2 | 4 | 15.5 | 46.2% | 51.3% | 121.5 | 29.8 |
| Matt Corral | OLE | 146 | 66 | 2448 | 16 | 11 | 6 | 16.8 | 45.2% | 49.3% | 97.0 | 32.8 |
| Malik Willis | LIB | 123 | 49 | 1757 | 22 | 6 | 11 | 14.3 | 39.8% | 48.8% | 106.6 | 30.8 |
| Trevor Lawrence | CLEM | 183 | 77 | 2875 | 33 | 8 | 11 | 15.7 | 42.1% | 48.1% | 110.6 | 30.6 |
| Jalen Hurts | OKLA | 175 | 74 | 2802 | 20 | 6 | 9 | 16.0 | 42.3% | 47.4% | 113.2 | 30.4 |
| Sam Howell | UNC | 221 | 89 | 3302 | 42 | 9 | 15 | 14.9 | 40.3% | 47.1% | 110.3 | 32.7 |
| Kyler Murray | OKLA | 103 | 44 | 1703 | 19 | 10 | 3 | 16.5 | 42.7% | 45.6% | 89.8 | 31.6 |
| Kenny Pickett | PITT | 253 | 98 | 3537 | 34 | 15 | 17 | 14.0 | 38.7% | 45.5% | 101.3 | 29.3 |
| Justin Herbert | ORE | 239 | 88 | 2934 | 40 | 6 | 20 | 12.3 | 36.8% | 45.2% | 113.0 | 30.0 |
| Josh Allen | WYOM | 147 | 58 | 1802 | 27 | 8 | 7 | 12.3 | 39.5% | 44.2% | 102.9 | 30.2 |
| Sam Darnold | USC | 151 | 61 | 1871 | 18 | 7 | 4 | 12.4 | 40.4% | 43.1% | 107.6 | 28.8 |
| Desmond Ridder | CIN | 250 | 90 | 3120 | 39 | 8 | 15 | 12.5 | 36.0% | 42.0% | 110.3 | 29.6 |
| Drew Lock | MIZZ | 299 | 102 | 4055 | 42 | 18 | 20 | 13.6 | 34.1% | 40.8% | 97.1 | 31.7 |
| Jordan Love | UTST | 204 | 71 | 2462 | 31 | 8 | 12 | 12.1 | 34.8% | 40.7% | 104.6 | 29.4 |
| Josh Rosen | UCLA | 158 | 54 | 1989 | 21 | 9 | 10 | 12.6 | 34.2% | 40.5% | 98.5 | 30.5 |
| Lamar Jackson | LOU | 219 | 72 | 2597 | 30 | 15 | 15 | 11.9 | 32.9% | 39.7% | 89.9 | 31.7 |
| Mitchell Trubisky | UNC | 95 | 34 | 1258 | 14 | 2 | 3 | 13.2 | 35.8% | 39.0% | 114.8 | 32.0 |
| Trey Lance | NDSU | 59 | 20 | 807 | 12 | 1 | 3 | 13.7 | 33.9% | 39.0% | 114.9 | 34.2 |
| Daniel Jones | DUKE | 157 | 44 | 1513 | 15 | 11 | 13 | 9.6 | 28.0% | 36.3% | 69.9 | 30.5 |