Continuing with the series, I wanted to look at and provide more context with situational football for the position in the 2020 season using Sports Info Solutions (SIS). Similar to the last study I’m focusing on players selected in the 2022 NFL draft, and a few players were excluded due to SIS not tracking smaller school players. This time around I’ll key in on players with larger sample sizes as well. The goal for today is to see how George Pickens and Calvin Austin III stacked up to their peers in the 2020 season.
First, let’s look at opportunity with the number of routes run and targets on third down:
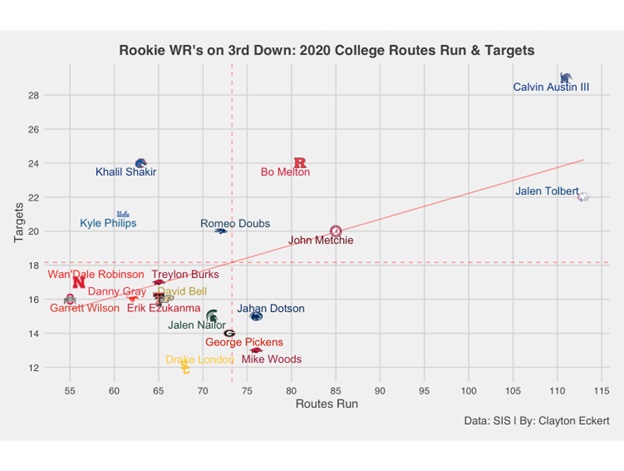
Right away we can see Austin III atop the results in situational football in 2020, as he did in the 2020 red zone study. He saw the most targets (29) on 111 routes run which ranked second, and interesting to see the substantial drop off that follows along with most of his peers at the bottom left of the graph. Pickens is one of these players, landing at the mean for routes run (73) along with 14 targets which was the third lowest mark. This initial view gives us important context for the Steelers draft picks as we continue with the data.
Now let’s dive deeper into these opportunities with completion percentage and on target catch percentage (total receptions/number of catchable targets) which highlights the quality of targets and connectivity:
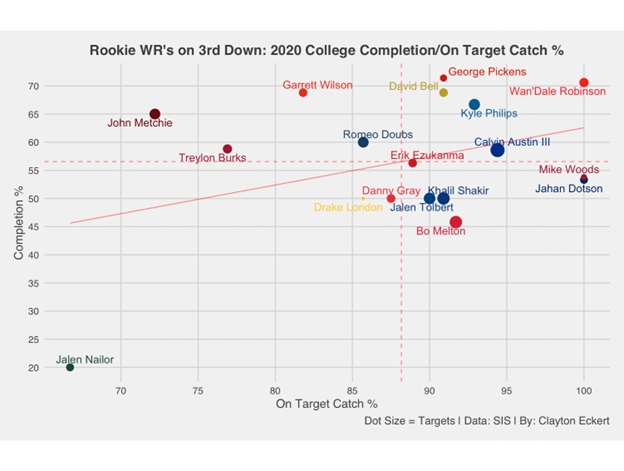
Encouragingly, both Pickens and Austin III land above the mean in each data point. The former had the top ranked completion percentage of 71.4% along with a strong on target catch percentage over 90%. The latter had the fourth ranked on target catch percentage along with an above the mean completion percentage, which is encouraging considering his strong 2020 red zone numbers as well, providing good catch rates in situational football compared to his lower results throughout the rest of the series.
Here is a similar view to the first study, viewing the wide receivers completed air yard percentage (CAY% = completed air yards/intended air yards) to gain context of opportunity and connectivity along with a and yards after catch percentage (YAC% = yards after catch/total yards) to see what wide receivers created once the ball was in their hands. This gives us great context of what the players provided for their team and how they were used, along with seeing who fared best on drive extending situations:
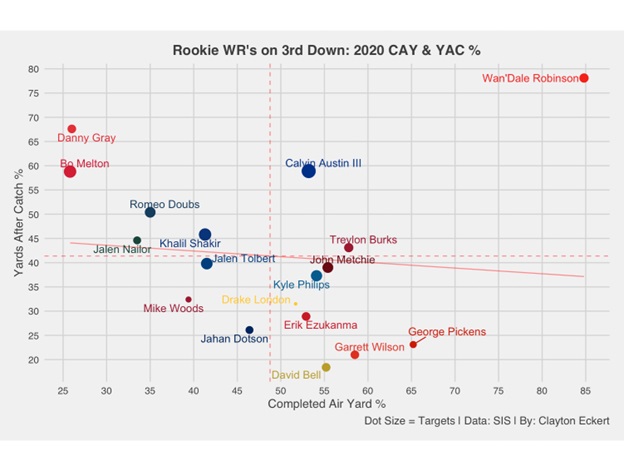
Austin III lands above the mean in both data points, especially providing great YAC value (third ranked YAC%) as we have seen in most instances of the series. His CAY% was above the mean at 53.2, an encouraging result after seeing his low number last season under 40%. He had his strongest third down yardage game against South Florida with 93 total yards, 54 intended air yards which were all completed, and 39 YAC yards which were all season highs.
Pickens fared very well in CAY% with the second rank, showcasing sure hands on the crucial down and in his overall game, and his third lowest YAC% highlighting the different ways the two Steelers receivers provided value. Pickens did provide a nice YAC play on third and ten against Missouri, running a slant against off coverage and making a guy miss for the 31-yard touchdown with 25 yards after the catch.
Let’s further examine wide receiver usage with average depth of target (average distance downfield that the targeted throws traveled, excluding spikes and throwaways) and average depth of completion:
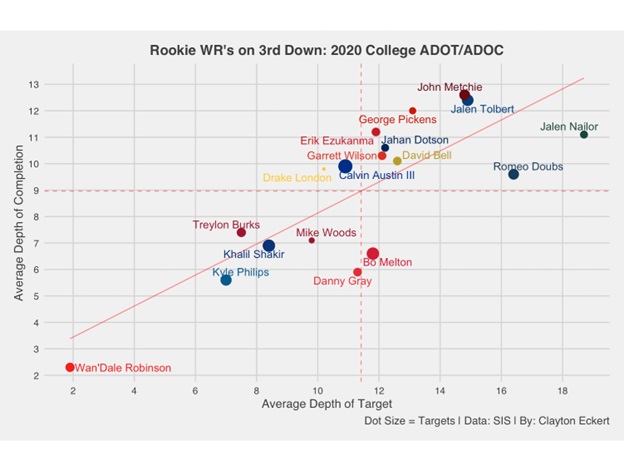
Pickens lands above the mean in both data points with the fifth rank in ADOT and even more impressive results in ADOC with the third rank. Both numbers being above 12 is healthy for the down and typical distance needed to convert, shedding more light on his high first down percentage. A good example was on a third and 12 play against Mississippi State when he showed great awareness, finding a soft spot in zone coverage, and stopping his route at the sticks for the conversion.
Austin III had an ADOT just below the mean of 10.9 along with a more encouraging ADOC just shy of ten. A particularly strong play came against UCF on third and 14, being pulled to the ground on the underthrown ball making an impressive combat catch that traveled 40 air yards. It’s great when the differential between the data points is narrow, maximizing the targeted yardage on his catches as opposed to players in the bottom middle of the graph or his results last season when his ADOT was nearly 12 with virtually the same ADOC.
Continuing with more important factors, here are the wide receivers first down percentages (percentage of receptions where the receiver achieved a first down) along with broken + missed tackles per reception, a fun and telling data point. The goal here is to see who provided moving the chains plays and which players showed the ability to make guys miss:
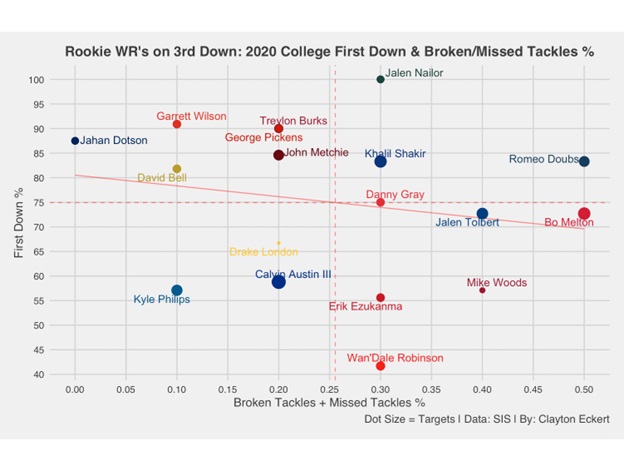
Pickens tied for the third highest first down percentage (90%), and here’s to hoping he can provide some value in this regard for the black in gold considering the issues Pittsburgh had sustaining drives with regularity last season. His broken + missed tackles percentage was below the mean (yet respectable), highlighting again that most of his value was in the air yard variety. Austin III landed in the same tier as Pickens in broken + missed tackles percentage but had a much lower first down percentage that was the fifth worst on the graph. So, while his completion rates were stronger than last season, his first down percentage was much lower.
To close I wanted to provide a total value view using points earned per route (The total of a player’s EPA responsibility on routes run using the total points system that distributes credit among all players on the field for a given play. Totals are scaled up to map to the average points scored or allowed on a team level, with the player’s snap count determining how much to adjust. For receivers, this includes accounting for offensive line play, off-target passes, dropped passes, and broken tackles. Values are modulated using a quality-of-competition multiplier based on each opponent’s previous year of performance) and EPA per target (the total change in the offense’s expected points that came on passes thrown to the player):
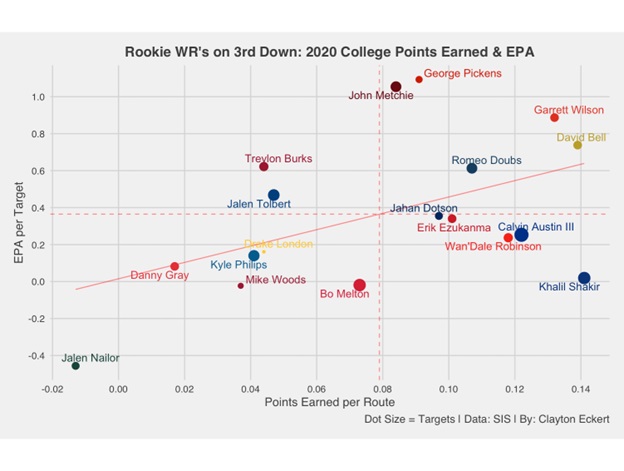
Five players land above the mean in both data points: Pickens, Alabama’s John Metchie (Texans), Ohio State’s Garrett Wilson (Jets), Purdue’s David Bell (Browns), and Nevada’s Romeo Doubs (Packers) with quality third down production and the dot sizes highlighting the quality.
Pickens lands above the mean in both data points, faring well in most aspects of the study. He lands atop the graph with the top rank in EPA per target and providing three of his six total touchdowns in 2020 on third down. On one touchdown he got a step on Auburn cornerback Roger McCreary off the line just outside the red zone, running a nice fade route on the end zone target, catch, and score. The second was another end zone target from the red zone on a hitch route, making a tough catch against tight coverage against Mississippi State. Pickens strongest marks were completion and on target percentages, CAY%, first down percentage, ADOT, ADOC, points earned per route, and EPA per target on an average number of routes run. His below average/lower results came in targets (important context), YAC%, and broken + missed tackle percentage. The film and data have me feeling optimistic that he could provide a valuable third down role his rookie season.
Austin III had the fourth ranked points earned per route along with being near the mean EPA per target. One of his two touchdowns was a play I highlighted in the red zone study, a game winner on third down for an impressive late fourth quarter comeback. He fared best in routes run, targets (most in the study), on target and completion percentages, CAY%, YAC%, ADOC, and points earned per route. He was below the mean in ADOT and EPA per target, along with his lowest marks coming in first down percentage and broken + missed tackles percentage. The data shows he was able to provide the most consistent value in each of the past two seasons in YAC% and ADOC. There was also an encouraging improvement in first down percentage last season, and the more I dove into the data and film, quarterback play was an apparent factor that aided his stronger results in 2020 especially in situational football, and negatively effected his results last season overall with completion rates being the primary concern.
It will be interesting to see what Pickens and Austin III’s opportunities as Steelers rookies look like, if either can provide third down value in their rookie season, and if so what their level of success is with the new faces competing for the starting quarterback job.
Throughout the rest of the offseason, I will dive deeper into the data as we continue to learn about the newest Pittsburgh Steelers. How do you think George Pickens and Calvin Austin III will fare in their rookie year? Do you think they will be a factor on third down? What are some of your takeaways across the league? Thanks for reading and let me know your thoughts in the comments!