Today I wanted to look at another important element for the 2022 quarterbacks, red zone performance using a variety of 2021 data from Sports Info Solutions. Let’s jump right in with completion percentage and on target percentage, which is defined as the number of catchable throws a quarterback makes divided by the total number of pass attempts excluding spikes, throwaways, QB/WR miscommunications, receiver slips, and batted passes:
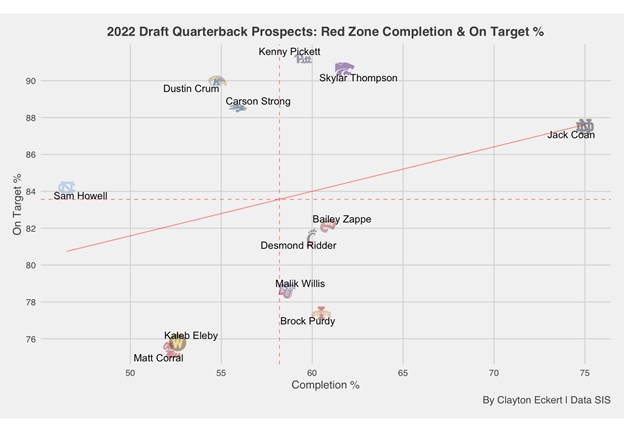
On the top right we can see Notre Dame quarterback Jack Coan had the highest overall completion percentage along with the fifth ranked on target percentage, highlighting great receiver play out of the 12 players on the graph, but important to note it was on the third fewest attempts. Kansas State quarterback Skylar Thompson had the second-best completion and on target percentage on the second fewest attempts. Pittsburgh quarterback Kenny Pickett is the final player above the mean in both data points, with the best on target percentage and sixth ranked completion percentage on the second most attempts, which is over twice as many attempts as the previously mentioned players. This highlights his impressive accuracy and volume in scoring situations where defenses have less ground to cover.
Kent State quarterback Dustin Crum has the third ranked on target percentage on the seventh most attempts and the ninth ranked completion percentage, highlighting his accuracy but lacking help from his teammates on the receiving end. Similarly, Nevada quarterback Carson Strong had the fourth ranked on target percentage and eighth ranked completion percentage on the third most attempts, and this greater volume accentuates his value but missed opportunities by the receivers. North Carolina quarterback Sam Howell had the sixth ranked on target percentage on the sixth most attempts but lowest ranked completion percentage, highlighting his average accuracy compared to the other quarterbacks and lack of connectivity as a team.
Western Kentucky quarterback Bailey Zappe had the seventh ranked on target percentage and third ranked completion percentage with the most attempts by far, highlighting better support from his teammates comparatively. Similarly, Cincinnati quarterback Desmond Ridder had the eighth ranked on target percentage and fifth ranked completion percentage and attempts, with his receivers capitalizing despite lower accuracy.
Liberty quarterback Malik Willis had the ninth ranked on target percentage and seventh ranked completion percentage on the fewest attempts, highlighting the lack of volume and below average accuracy. Iowa State quarterback Brock Purdy had the tenth ranked on target percentage, fourth ranked completion percentage, and tied for the eighth most attempts which shows his supporting cast capitalizing despite below average accuracy.
The remaining players left much to be desired overall. Western Michigan quarterback Kaleb Eleby had the 11th ranked on target percentage, tenth ranked completion percentage, and tied for the eighth rank in attempts. Ole Miss quarterback Matt Corral had the bottom rank in on target percentage and 11th rank in completion percentage on the fourth most attempts!
Level of competition is important to factor, with quarterbacks having different qualities of supporting casts and defenses they faced. Now let’s look at touchdown and interception percentages:
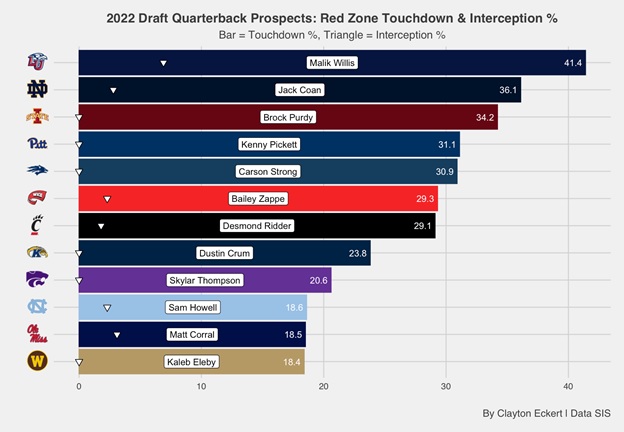
Willis has the top touchdown percentage and the highest interception percentage, over twice the percentage as any other player, confirming many of our priors of the highs and lows in his game. Coan ranks second in touchdown percentage but the third highest interception percentage.
Purdy, Pickett, and Strong had an above 30% touchdown number, and took care of the ball with no interceptions! The result of the latter two players is especially impressive considering their higher number of attempts.
Zappe and Ridder had high 20 touchdown percentages and similar interception results, and important to remember the former had far more attempts.
Crum and Thompson also had no interceptions in the red zone and 20+ touchdown percentages with the formers result being more impressive on more volume and a higher touchdown rate.
Howell, Corral, and Eleby have very similar touchdown percentages, with Corral having the second highest interception percentage, Howell tied with the fourth highest, and Eleby with no interceptions on the fewest attempts of the three.
Next, let’s layer more context with who saw more pressure along with sack percentages in the red zone:
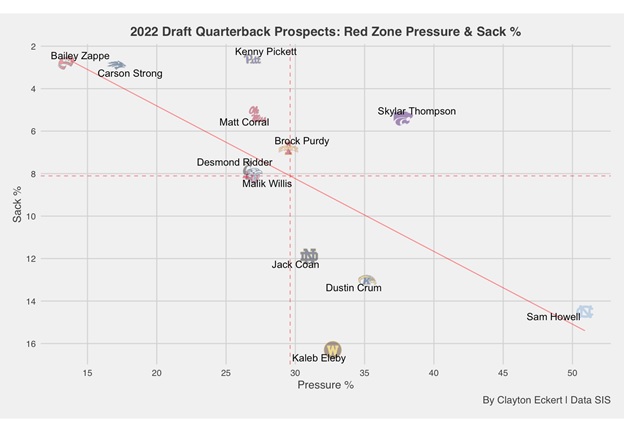
The most pressured quarterback by far was Howell, adding context (while not totally excusing) his results thus far, along with his 11th rank in sack percentage. Thompson had the second highest pressure percentage and fifth lowest sack percentage, highlighting good situational awareness, especially having zero interceptions. Crum and Eleby were pressured and sacked at a high rate, an important layer of context after seeing them without interceptions and the former with a higher touchdown percentage. Coan was pressured at an above the mean rate, adding some positive context to his prior results but had the fourth highest sack percentage.
The remaining players were pressured under 30% of the time, therefore landing on the top left of the graph with lower sack percentages. This is important context when considering all the data, with less pressure situations obviously setting a passer up for expected success. Of this group of players, Purdy was pressured the most with the third highest sack percentage. Pickett, Corral, Ridder, and Willis were all pressured at a similar rate with Pickett’s results really sticking out positively so far with the lowest sack rate, no interceptions, high touchdown percentage, and best on target percentage! Ridder and Willis land nearly identical on the graph, taking the most sacks in this group.
The least pressured quarterbacks were Strong and Zappe, understandably giving them low sack percentages and being in the most ideal pockets, which is crucial context as we consider all the data.
To close, here is a total value view using expected points added (EPA) per attempt and points earned, which is defined as the total of a player’s EPA responsibility on passes using the Total Points system that distributes credit among all players on the field for a given play. Totals are scaled up to map to the average points scored or allowed on a team level, with the player’s snap count determining how much to adjust. For passers, this includes accounting for offensive line play, sacks, off-target passes, dropped passes, and dropped interceptions:
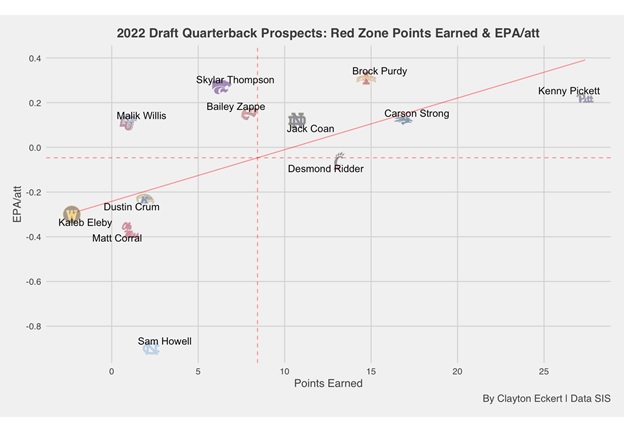
Pickett lands at the top as I expected learning from the data, with the top rank in points earned and third ranked EPA/att. Strong ranks second in points earned and tied for fifth in EPA/att, faring well in the data overall. While he was not pressured much, he had good accuracy, a higher touchdown percentage with no interceptions or many sacks. Both men had higher sample sizes which is encouraging, and it will be interesting to see if they can carry over this success against NFL defenses.
Purdy had the top rank in EPA/att and third rank in points earned on a lower number of attempts, but the data suggests his receivers really helped him last season despite his low on target percentage. He had a strong touchdown percentage, no interceptions, and lower sack rate considering the average amount of pressure he faced. Coan had the fifth rank in points earned and tied for fifth in EPA/att, fared well with high accuracy rates and touchdown percentage on a lower number of attempts, but had interceptions and took sacks at a higher rate.
Ridder had the fourth rank in points earned and eighth rank in EPA/att on the fifth most attempts, with below average accuracy, a middling touchdown and interception percentage, and took a higher number of sacks while being pressured at a below average rate. Zappe had the fourth ranked EPA/att and sixth rank in points earned on the most attempts by far, was pressured and sacked at low rates, but had more middling results in accuracy, touchdowns, and interceptions.
Thompson had the second rank in EPA/att and seventh rank in points earned with one of the lower sample sizes, was accurate, had no interceptions, and a lower sack percentage despite a high pressure rate, but lower touchdown percentage. Willis had the seventh rank in EPA/att and 11th rank in points earned on the fewest attempts, with the touchdown and interception ratios sticking out, lower accuracy, and taking more sacks while being pressured at a below average rate.
The remaining players were below the mean in both data points. Crum had the ninth rank in points earned and EPA/att, and while he was pressured at a high rate, was accurate and didn’t have any interceptions, but was sacked at a high rate and had a lower touchdown percentage. Corral ranked tenth in points earned and 11th in EPA/att, and while being pressured at a below average rate and lower sack percentage, had the lowest on target percentage, second lowest touchdown percentage, and second highest interception rate on the fourth most attempts.
Eleby ranked last in points earned (the only negative number) and tenth in EPA/att on a lower sample size, and while he had no interceptions and only pressured slightly above average, fared poorly in accuracy, had the lowest touchdown rate and highest sack percentage. Howell ranked last in EPA/att by a wide margin and eighth in points earned, and the data confirms prior opinions of a weaker supporting cast last season with the lowest completion percentage but average on target percentage, a low touchdown rate, the fourth highest interception percentage, and second worst sack percentage on the highest pressure rate of over 50%!
What are your thoughts on the red zone data for this year’s quarterback draft prospects? Thanks for reading and let me know your thoughts in the comments!