Today I wanted to look at some data for the season, discuss takeaways for the Pittsburgh Steelers week nine matchup against the Chicago Bears on Monday night, and pose some questions for you the readers.
First, let’s look at quarterbacks with the following data points:
- Completed Air Yards = Vertical yards completed on a pass attempt at the moment the ball is caught in relation to the line of scrimmage
- Intended Air Yards = Vertical yards intended on all pass attempts in relation to the line of scrimmage
- Aggressiveness = Amount of pass attempts a quarterback makes that are into tight coverage where there is a defender within 1 yard or less of the reception or incompletion as a percentage

Looking at the graph with the Monday night game in mind, we can see Bears quarterback Justin Fields lands on the top middle of the graph and above the mean in both data points with an intended air yards number of 8.9 which ranks fifth and a completed air yards number of 6.2 ranking 13th out of 35 quarterbacks. The dot sizes are the aggressiveness data point, where Fields ranks first at 20.3%, highlighting he is throwing into tight coverage at the highest rate of any quarterback. This is negatively affecting his total completion percentage of 59.5% which is the third lowest of the group. If the data points hold true for Fields in this game, the Steelers defense could have a good opportunity to provide a takeaway via an interception that they can hopefully capitalize on.
Steelers quarterback Ben Roethlisberger lands on the lower left of the graph and below the mean in both data points. His intended air yards number of 6.9 ranks 30th along with a completed air yards number of 4.4 which ranks 33rd out of 35 quarterbacks. Roethlisberger ranks seventh in aggressiveness at 17.8% but has a higher total completion percentage than Fields at 65.1% ranking 23rd. It will be interesting to see how Roethlisberger plays considering his appearance on the injury report but practicing fully to end the week and being good to go for the game.
How do you think the quarterbacks will fare on Monday night? What are some of your favorite takeaways league-wide?
Next, let’s look at running backs using the following data points:
- Time To Line Of Scrimmage = Amount of time a ball carrier spends before crossing the line of scrimmage
- Rush Yards
- Rush Attempts

Steelers running back Najee Harris is above the mean in both data points with his time to line of scrimmage ranking ninth out of the 38 backs on the graph. He also ranks fourth in rush attempts and tenth in rushing yards, highlighting the Steelers improvement in the running game and the offensive line as the season has progressed.
Bears running back David Montgomery has been on the injured reserve list since early October, but it was announced he will be active for Monday’s game. Montgomery lands on the lower right of the graph due to his time to line of scrimmage number which ranks 12th and lower rushing yards due to the time he has missed.
Bears running back Khalil Herbert has been starting with Montgomery out and falls on the bottom left of the graph. His time to line of scrimmage rank is the lowest out of the backs we will see on Monday night and ranks 34th out of all the running backs. It will be very interesting to see what Chicago’s running back workload looks like and if the Steelers can provide stout run defense as we saw last week against the Browns.
How do you think the running backs will fare? How about the offensive lines in the run blocking department? What are your favorite results league-wide?
Now let’s look at wide receivers using the following data points:
- Cushion = The distance in yards measured between a wide receiver and the defender they’re lined up against at the time of snap on all targets
- Separation = The distance in yards measured between a wide receiver and the nearest defender at the time of the catch or incompletion
- Targeted Air Yards Percentage = The sum of the wide receivers total intended air yards on all attempts over the sum of his team’s total intended air yards as a percentage
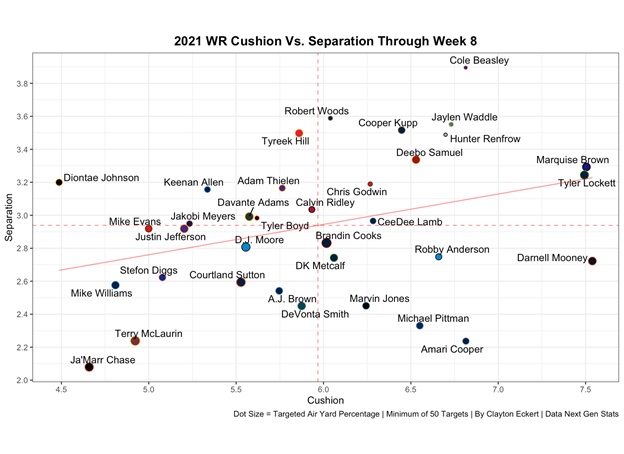
On the far right of the graph we can see Bears wide receiver Darnell Mooney is getting the most cushion off the line of scrimmage but is below the mean in separation. His targeted air yards percentage is 37.5 which ranks 10th out of 35 players on the graph but he has a low catch percentage of 62.3 on his 11.2 targeted air yards, highlighting the need for the Steelers secondary to be ready for his targets but hopefully limiting the connection with Fields as past opponents have been able to do. Mooney was limited in practice through the week and listed as questionable for the game.
Bears wide receiver Allen Robinson has surprisingly not seen the workload that many expected this season, seeing 11 targets in week one but no more than four catches per game since week two. It will be very interesting to see if this trend continues, considering he was 1000+ yard receiver recently in both 2019 and 2020. If Mooney is unable to go, it could lead to more targets for Robinson but would allow the Steelers secondary to give more attention to him in coverage.
Pittsburgh wide receiver Diontae Johnson lands on the top left of the graph highlighting his above the mean separation number of 3.2 which ranks 10th! He is also seeing the least amount of cushion out of these wide receivers making his separation number even more impressive. Johnson has a targeted air yards percentage of 31.7 which ranks 21st along with a catch percentage of 63.5 ranking 24th along with a 9.2 targeted air yards number.
Steelers wide receiver Chase Claypool had his second most efficient game in week eight against the Browns catching four of his five targets while playing 97% of the offensive snaps. His strongest showing was in week five against the Broncos, catching five of six targets for his highest catch percentage of the season at 83.3 on an impressive air yard number of 21.7! The other four games he has played this season have been low catch percentage games of 60% or below, highlighting the inconsistency with a season average of 57.5.
Which wide receivers do you think will excel in this game? What are your favorite takeaways league-wide?
Here’s a view for tight ends using the same data points as the wide receivers:
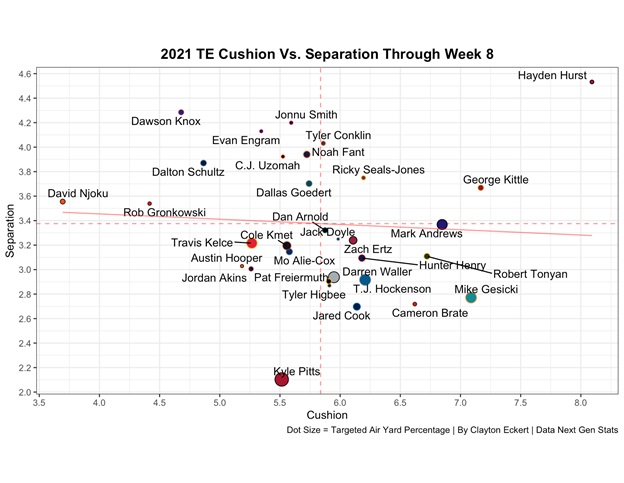
Bears tight end Cole Kmet lands toward the middle of the graph but below the mean in both data points. His cushion number is 5.6 which ranks 22nd and his separation number of 3.2 ranks 19th out of the 32 tight ends on the graph. The dot sizes show targeted air yard percentage, where Kmet ranks seventh out of tight ends at 17.2% but a total catch percentage of 61.1 that ranks 29th, which is similar to the takeaway for Mooney in that the Steelers defense will need to be ready for him to be targeted but hopefully limiting the connection.
Steelers tight end Pat Freiermuth lands on the low middle of the graph, just above the mean with his 5.9 cushion number that ranks 15th but a lower separation number than Kmet of 2.9 which ranks 27th. His targeted air yards percentage of 10.1% is trending upward in recent weeks and ranks 18th but his catch percentage came down from a recent top rank to 5th out of tight ends at an 81.5%. With tight end Eric Ebron out for another game, Freiermuth’s target trend will likely continue Monday night.
The biggest takeaway from the Bears Saturday injury report is Khalil Mack being ruled out for the matchup. What a huge break for the Steelers offensive line and likely a big factor for the hopes of a continued positive trend for this group.
Thanks for reading and let me know your thoughts in the comments!