Since being named the offensive coordinator, the phrase “in Matt Canada’s offense” has gotten thrown around a lot. We have our guesses about what it will look like but until he unveils it, it remains to be seen.
In his college career he has been flexible by catering his offense to the personnel he has to work with. He has run spread offenses with success as well as power run offenses. One main cog is the use of motion and we got a glimpse of that last year.
I was curious about the usage and production of the shifts and motion used so I dove into our charts to take a look with a focus on the production with motion at the snap. This is going to be a data dump to show some of the numbers and trends we saw in 2020.
Pre Snap Movement Totals
First chart is going to be a total number of plays where there was any type of shift before the snap. The Steelers average 26.8 snaps per game with some type of shift. As you can see, the total number diminished as the game progressed with less usage in the second half of games.
There was movement on 38% of the total plays (1,205) in the 2020 season. The high watermark came in week 17 with 40 of 69 plays (58%) using pre snap movement. It’s speculation but it’s possible that with the Steelers resting some starters that Canada was given a bigger hand in the offense that week.
The low water mark was in the playoff game with just 13 of 90 plays (14%) of the total plays and the only game with no motion/shifts in the second half. With the Steelers so far behind the game plan kind of when out the door so this isn’t surprising.
| Week | Game | All Shifts | Q1 | Q2 | Q3 | Q4/OT |
| WK1 | NYG | 32 | 11 | 9 | 4 | 8 |
| WK2 | DEN | 29 | 10 | 4 | 7 | 8 |
| WK3 | HOU | 38 | 6 | 10 | 11 | 11 |
| WK5 | PHL | 36 | 11 | 11 | 8 | 6 |
| WK6 | CLE | 23 | 7 | 4 | 8 | 4 |
| WK7 | TEN | 30 | 9 | 9 | 6 | 6 |
| WK8 | BAL | 16 | 4 | 6 | 5 | 1 |
| WK9 | DAL | 19 | 9 | 5 | 2 | 3 |
| WK10 | CIN | 28 | 11 | 9 | 5 | 3 |
| WK11 | JAX | 29 | 8 | 9 | 8 | 4 |
| WK12 | BAL | 26 | 9 | 5 | 5 | 7 |
| WK13 | WAS | 28 | 9 | 11 | 5 | 3 |
| WK14 | BUF | 24 | 11 | 7 | 4 | 2 |
| WK15 | CIN | 26 | 13 | 7 | 3 | 3 |
| WK16 | IND | 19 | 10 | 3 | 3 | 3 |
| WK17 | CLE | 40 | 12 | 13 | 5 | 10 |
| WK18 | CLE | 13 | 11 | 2 | 0 | 0 |
| Totals | 456 | 161 | 124 | 89 | 82 | |
| Percentage | 38% | 35% | 27% | 20% | 18% |
After the Steelers had their first loss against Washington there was an increase in movement over the final 5 games. The usage jumped from 35% to 42% from week 14 with movement on 150 of 354 plays.
Moving at the Snap
Digging a little deeper into those numbers we look at the focus of a player moving at the snap. On 171 of the total plays Pittsburgh had a player in motion at the snap. In 8 of the first 9 weeks the Steelers hit double digit snaps with motion and hit that threshold just once in the second half of the season. We’re going to look at the production on these plays a little later.
| Week | Game | Moving Count | Q1 | Q2 | Q3 | Q4/OT |
| WK1 | NYG | 14 | 5 | 6 | 0 | 3 |
| WK2 | DEN | 10 | 4 | 2 | 2 | 2 |
| WK3 | HOU | 10 | 1 | 2 | 4 | 3 |
| WK5 | PHL | 22 | 8 | 6 | 4 | 4 |
| WK6 | CLE | 14 | 5 | 0 | 5 | 4 |
| WK7 | TEN | 14 | 5 | 3 | 4 | 2 |
| WK8 | BAL | 5 | 0 | 3 | 2 | 0 |
| WK9 | DAL | 12 | 6 | 2 | 1 | 3 |
| WK10 | CIN | 15 | 9 | 1 | 2 | 3 |
| WK11 | JAX | 7 | 0 | 3 | 0 | 4 |
| WK12 | BAL | 6 | 3 | 1 | 1 | 1 |
| WK13 | WAS | 3 | 1 | 2 | 0 | 0 |
| WK14 | BUF | 8 | 3 | 4 | 1 | 0 |
| WK15 | CIN | 8 | 3 | 4 | 1 | 0 |
| WK16 | IND | 5 | 2 | 1 | 1 | 1 |
| WK17 | CLE | 13 | 6 | 3 | 2 | 2 |
| WK18 | CLE | 5 | 4 | 1 | 0 | 0 |
| Totals | 171 | 65 | 44 | 30 | 32 | |
| Percentage | 14% | 38% | 26% | 18% | 19% |
Scripted Plays
It’s common for teams to script plays to be used at the beginning of the game. I pulled the first 15 plays from each game to give an idea of how often shift and motions were part of the script and also added from play 16 on to show the difference.
There was big difference between scripted plays and those that follow with 60% of the first 15 plays having pre snap motion and 32% of the plays after the first 15 using movement.
There were 255 plays in the first 15 with 154 having some type of movement and 63 (25%) with a player in motion at the snap. After the first 15 there was 950 plays with an even 300 having pre snap movement and 100 (11%) with a player in motion.
It is conceivable Canada could have had more influence in the scripted plays rather than during the flow of the game. You can see there was an obvious focus on pre snap movement early in the game.
| Week | Game | First 15 | Total | Moving | Play16+ | Total | Moving |
| WK1 | NYG | 15 | 11 | 5 | 50 | 21 | 5 |
| WK2 | DEN | 15 | 10 | 4 | 51 | 19 | 6 |
| WK3 | HOU | 15 | 4 | 1 | 65 | 34 | 9 |
| WK5 | PHL | 15 | 9 | 5 | 63 | 27 | 15 |
| WK6 | CLE | 15 | 6 | 5 | 50 | 17 | 9 |
| WK7 | TEN | 15 | 6 | 3 | 65 | 24 | 11 |
| WK8 | BAL | 15 | 6 | 1 | 39 | 10 | 4 |
| WK9 | DAL | 15 | 10 | 6 | 54 | 9 | 6 |
| WK10 | CIN | 15 | 9 | 8 | 58 | 19 | 7 |
| WK11 | JAX | 15 | 8 | 3 | 62 | 21 | 4 |
| WK12 | BAL | 15 | 9 | 3 | 57 | 17 | 3 |
| WK13 | WAS | 15 | 9 | 1 | 57 | 19 | 2 |
| WK14 | BUF | 15 | 11 | 3 | 44 | 13 | 5 |
| WK15 | CIN | 15 | 13 | 3 | 51 | 11 | 3 |
| WK16 | IND | 15 | 10 | 2 | 55 | 9 | 3 |
| WK17 | CLE | 15 | 12 | 6 | 54 | 28 | 7 |
| WK18 | CLE | 15 | 11 | 4 | 75 | 2 | 1 |
| Totals | 255 | 154 | 63 | 950 | 300 | 100 | |
| Percentage | 60% | 25% | 32% | 11% |
During the winning streak to start the season and in the last six games there were changes as well. The scripted plays increased in pre snap movement by 20% but after the first 15 plays the number took quite a dip.
| Games | First 15 | Total | Moving | Play16+ | Total | Moving |
| Through week 12 | 165 | 88 | 44 | 614 | 218 | 79 |
| Percentage | 53% | 27% | 36% | 13% | ||
| Week 13 on | 90 | 66 | 19 | 336 | 82 | 21 |
| Percentage | 73% | 21% | 24% | 6% |
I thought some of the drop in motion during the last six games could be attributed to the offense playing from behind more often but the number showed that change was minimal. They just weren’t using the movement as much once the scripted plays were done.
Production Off of Motion
This section I was really interested to see and wanted to see the answers to some questions. When did they run motion? Who was in motion? Did the use of motion at the snap improve the production of the offense? Let’s take a look.
First off I looked at a breakdown of downs to answer when they were in motion. Of the 171 plays with a player in motion 97 was on first down and 61 on second down. Of the 171 snaps, 92% of the motion plays were on first or second down.
On third down, when deception would be helpful to move the defense to give them an advantage they ran just 9 plays (5%) with a man in motion at the snap. That number was a surprise. They also used motion on 4 fourth down plays.
Who was in Motion?
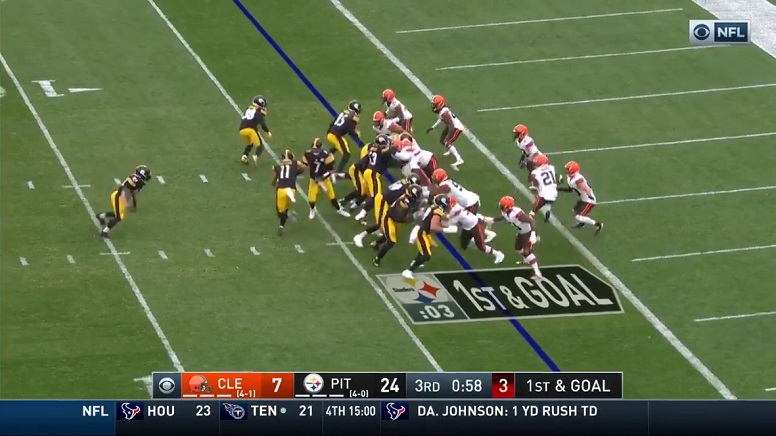
On 162 of the 171 plays with motion at the snap it was a wide receiver on the move. Chase Claypool was used most often and a part of that was the goal line package where he ran in a couple of jet sweeps for touchdowns. He had 71 total snaps on the move with 61 resulting in running plays. He had 6 run touches for 10 yards with 2 touchdowns. He was thrown the ball 4 times with two completions for a net zero yards.
Next was Ray-Ray McCloud with 29 snaps (16 run/13 pass) and was used often on fly sweeps and passes in his limited usage on offense. He ran the ball one time for five yards and had 7 receptions for 16 yards. All of those passes were behind the line of scrimmage.
James Washington was used in motion on 29 plays with 24 resulting in a running play. Using him in motion was ineffective for the offense and especially for him. The offense managed just 60 yards on those 29 plays. Washington had zero runs and zero catches on plays were he went in motion. Letting the defense know that when he went in motion the play would essentially be 10 on 11.
Diontae Johnson was in motion at the snap on 20 offensive plays with 16 being running plays. Those running plays produced 57 yards (3.56) which was fairly good compared to the rest. He was targeted 3 times (all behind the LOS) with 3 receptions for 16 yards.
JuJu Smith-Schuster was used least often of the receivers with 15 snaps in motion. Ten of those resulted in runs gaining 28 yards and he was targeted five times with two completions for 15 yards. Two of those targets were behind the LOS and 2 were over ten yards downfield.
Total Production on Motion Plays
While the concept of adding more movement to the offense was a welcome and needed change, the results left a lot to be desired.
They ran the ball 75% of the time with 129 of the 171 plays being running plays. The offense totaled 413 yards on those runs for a 3.23 yard per carry average. They did produce 4 touchdowns.
| Player | Carries | Yards | Average |
| James Conner | 79 | 281 | 3.56 |
| Benny Snell | 29 | 66 | 2.28 |
| Anthony McFarland | 13 | 51 | 3.92 |
| Chase Claypool | 6 | 10 | 1.67 |
| Ray-Ray McCloud | 1 | 5 | 5.00 |
| Totals | 128 | 413 | 3.23 |
Throwing the ball was not a better option. There were 24 completions on 38 attempts with one interception for 93 yards and zero touchdowns. Not good but when 23 of those attempts were at or behind the line of scrimmage it make a more sense but not any prettier. Past the line of scrimmage they were 4 of 15 for 3 yards.
| Pass Distance | Completions | Targets | Yards |
| At or behind LOS | 20 | 23 | 63 |
| Within 5 yards of the LOS | 4 | 8 | 30 |
| Over 10 yards | 0 | 7 | 0 |
| Totals | 24 | 38 | 93 |
A whopping 88% of the plays with a man in motion at the snap resulted in a run or a pass behind the line of scrimmage. Not the offensive variation we were hoping for with the addition of more motion.
The other five plays include two aborted plays, one no play, one sack and one penalty.
Of the 506 yards produced 143 of them came on just nine plays (6 runs/3 passes).
The average depth of target on completions was -2 yards and the average depth of target on incompletions was 10.8 yards. Not good any way you look at it.
Conclusion
The addition of Canada to the staff led us to believe that there would be more movement in the offense and it looks like that was definitely the case especially early in the game. The creativity of the offense using motion seemed to be limited to the running game and throws behind the line of scrimmage but with Canada at the helm going forward there’s hope that there will be improved play call variance as well as production.
Canada has a knack for adapting to his personnel and putting together productive offenses so the 2020 stats should be looked at for what they are, last year’s stats. They should have no bearing on what to expect because we don’t know just how much Canada was involved.
The Steelers still have a ton of talent at the skill positions and the additions of Najee Harris and Pat Freiermuth should only help. It will be exciting to see what Canada can put together with this talented group.