Are you ready for yet another article debating the merits of drafting a running back in the first round? Well, you’re in luck…sort of. I hope this article is a little different. I’m not here to shove my opinion on the matter down your throats; I’m going to try and keep my opinion out of it and just relay some interesting facts related to the matter. I wanted to look into the facts and figures related to some of the common refrains we all here related to RBs in the NFL, and particularly as they relate to the draft, you know the ones:
- RBs have been devalued in the draft
- Never draft a RB in the first round
- RBs are fungible, replaceable, little difference between the elite and the replacement level players.
- You can find RBs anywhere, specifically in mid to late rounds of the draft
I’ve seen each of these points addressed countless times from various angles, and from both a supporting and a refuting perspective. However; these are often opinion based, or use a few examples to prove a point, rather than looking at complete data sets. That’s what I hope to do here and just see what the RB position in the NFL actually looks like.
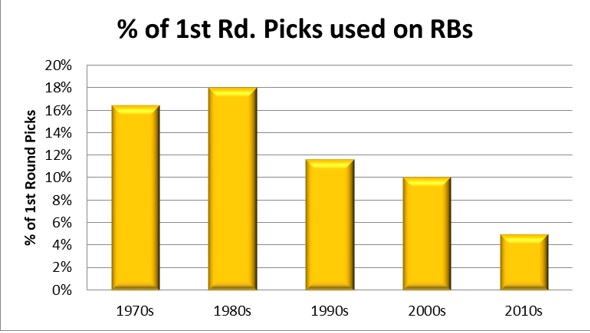
The easiest thing to look at is have running backs actually been devalued in the draft? That’s easy enough to determine. I pulled the percentage of first round picks used on running backs by decade (all draft data courtesy of Pro Football Reference); I used percentages to account for the differing number of teams over the years. There is a clear and obvious decrease in the percentage of RBs taken in the first round, with the 1980s seeing a peak of 18% of first round picks at the position, while the 2010s was down to 5%. Clearly the position has been deemphasized in the first round of the draft, for whatever reason. This could be to a myriad of factors: Other positions gaining prominence, RBs being less important; teams collectively deciding to wait on the RB position, driving the collective draft cost down, etc.
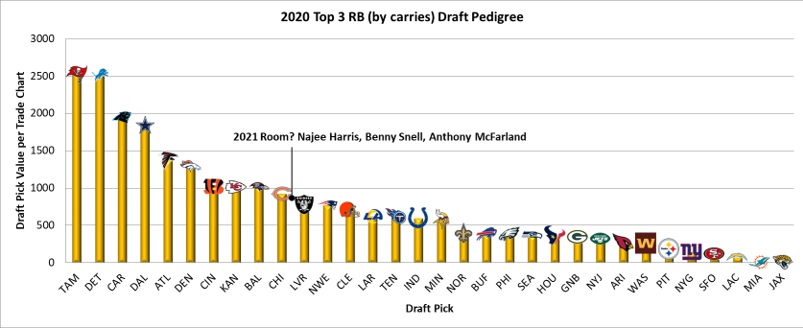
So who actually were the top RBs in the NFL last year? I wanted to know who each team’s leading rusher, by yards, was for the 2020 season. While limited to a single year sample, I think this is a good approach, because it captures many of the factors that are brought up relating to why investing high picks in a RB is worthwhile or not (injuries, being outperformed by lower picks, UDFA success etc.). In the below chart, I’ve also sorted thing relative to the Steelers. For each player, I determined where the Steelers would have had to have had selected them in the draft, based on their natural draft slot (i.e. without trading up/down).

There are some interesting things here. Four of the top RBs went before the Steelers’ natural first round pick in the draft, meaning they would have required a trade up to have a shot at drafting them. Another eight went before the Steelers’ second round pick in the corresponding year. So 12 of the 32 lead RBs in the league would have required the Steelers to draft them with their first round pick or even trade up. Another 10 went before the Steelers’ third round pick.
Finally, the last 10 could have been had at the Steelers’ third or later (including Conner). So two-thirds of the lead RBs would have been first or second-round investments for the Steelers. That’s not what I necessarily expected, with how much “you can find RBs anywhere” gets parroted. And this accounts for everything that happens over the course of a season. Injury (Giants should have had Barkley as their lead guy, but he was hurt so fourth rounder Wayne Gallman led the way) and performance (first-rounder Penny for the Seahawks playing behind Chris Carson who they obtained in the seventh for example).
It also shows how just talking in terms of draft round can be pretty misleading. Kamara and Conner were both third-round picks in 2017, but Conner was taken with the 105th pick, and Kamara the 67th, 38 players being selected between the two. Kamara’s draft slot was right in the cluster of a lot of lead rushers, while Conner fell noticeably on the tail end of things.
Two of eight players drafted after Conner on this list rushed for more yards in 2020. Fifteen of 23 players drafted ahead of Conner rushed for more. I was slightly surprised Conner was not closer to the bottom of this list, with the Steelers being last in rushing, and him missing five games. Part of that is other teams having injuries at the RB position, or just being committed to more of a committee approach than Mike Tomlin likes to employ.
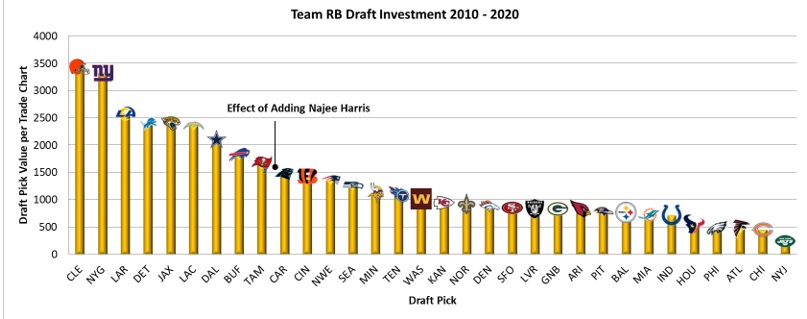
Another thing to consider is what each team’s running back room as a whole looked like in terms of draft pedigree. I knew the Steelers had quite a few mid-round picks. Conner (third), Snell (fourth), and McFarland (fourth) were the Steelers’ top three RBs in terms of carries. That seems like decent draft pedigree in the room, but how did that stack up around the league? To do this comparison, I landed on using a draft pick trade value chart, because this lets us put a single number on it, rather than having to try and parse through how many first round picks vs. how many mid-round picks etc.
The Steelers’ RB room in 2020 was 27th-lowest in total draft pedigree. Now, the higher picks greatly increase the total pick value in the room, and those high picks were not necessarily spent by the team currently employing the player, nor were they necessarily the lead RB. Tampa Bay, for example, had Leonard Fournette, a fourth overall pick, in their room. He was their #2 RB and added via free agency, but that’s not what I was concerned about. I wanted to know how much draft pedigree was in each RB room, and the answer was most of the league had a much higher-pedigreed RB room than the Steelers in 2020.
Whether by investing draft picks themselves, or bringing in former high picks at the position, most NFL teams had better RB rooms on paper than the Steelers. That in and of itself is not a good or bad thing, it just adds contexts to the mid-round picks the Steelers had as their RB group. With Najee Harris on board, the Steelers’ 2021 RBs look much different.
What type of draft investment each team made at the position also might be of some interest. In the prior 11 drafts (2010-2020), the Steelers invested eight draft picks in the RB position, with a total pick value of 779.6 per the trade chart. That ranked 25th in the league in terms of draft capital invested in the position. Bell, Conner, and unfortunately Archer were their only significant investments in the position; so despite the number of middle to lower round picks they threw at the position, most other teams invested more heavily.
Adding Najee Harris into the mix was obviously a much larger investment, and greatly increased their total investment at the position over recent years. The trade value of the 24th pick used to select Harris is worth 740 points, which is only slightly less than the combined values of all their other drafts picks used on the position since 2010.
| Year | Rnd | Pick | Player | Pos | Pick Value |
| 2010 | 6 | 188 | Jonathan Dwyer | RB | 14.6 |
| 2011 | 7 | 232 | Baron Batch | RB | 1 |
| 2012 | 5 | 159 | Chris Rainey | RB | 26.2 |
| 2013 | 2 | 48 | Le’Veon Bell | RB | 420 |
| 2014 | 3 | 97 | Dri Archer | RB | 112 |
| 2017 | 3 | 105 | James Conner | RB | 84 |
| 2018 | 5 | 165 | Jaylen Samuels | RB | 23.8 |
| 2019 | 4 | 122 | Benny Snell Jr. | RB | 50 |
| 2020 | 4 | 124 | Anthony McFarland Jr. | RB | 48 |
| 2021 | 1 | 24 | Najee Harris | RB | 740 |
I also wanted to look at the draft in general and how RBs performed by draft round, and look into some career lengths for various positions. I started by looking at drafts from 2000 — 2016, but that resulted in 14% of those players still being active in 2020. This was too high, so I ultimately limited it to 2000 — 2011 where only 4% of players were active in 2020. For this study, I primarily looked at the median, as opposed to the average. For a quick refresher, the median is the number you get when you line all your data points up in order, and just take the number in the middle. So 50% of the numbers are less than the median, and 50% are greater than it (more or less). This helps eliminate the effect of a few high outliers that would skew the average.
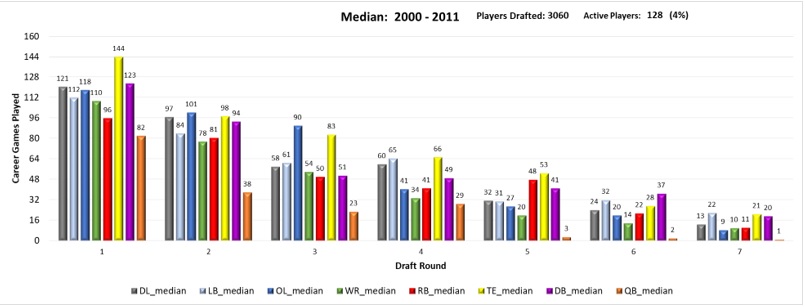
I wanted to see if the common adage of “RBs have short careers” was true, by looking at the median career games played. I understand where the idea comes from, that the physically demanding position causes a lot of injuries, and RBs get worn down quickly. Injuries, however, are only one factor that can shorten a career. Many other factors, the biggest of which is probably just not being good enough, can end a player’s career sooner than one would want.
A couple of things stand out to me. Firstly, you see the expected decrease in career length as the rounds progress. While the draft is very hit or miss, and any given prospect could be a bust, over time the NFL generally gets it right by taking the better players first. There is probably an element of higher drafted players getting more chances, but actual talent level differences are certainly a large factor, perhaps the dominant one.
Second is the TE position. Just look at that career length in the first round, 144 games; that’s the equivalent of nine full 16 game seasons as the median career length for the 16 first round TEs drafted over that span. That’s pretty incredible, and contradicts the notion I’ve often heard stated that TEs have short careers due to the physically demanding position on a smaller body type (routinely blocking bigger players, and making a lot of catches in traffic etc.). The Steelers’ own Heath Miller came in even higher at 168 career games. Tight ends continue to have pretty long careers relative to other positions throughout the draft.
Next is that the QBs fall where I would have expected them to, at the lowest career length in every round. Successful QBs can have very long careers, but the hit rate is so low, that most are pretty short.
Third-round offensive line career lengths are a standout. I wonder if that’s indicative of decent depth at the OL position, or if it’s a product of there being so many OL jobs in the NFL, around eight per team?
Turning back to the RB position, they come in as the lowest career length of non-QBs in the first round with a median of 96 games (six full 16 game seasons). Linebacker and wide receiver are higher, but within a season’s worth of games of the RB position. Defensive line, offensive line, and defensive back are higher still, playing 22 to 27 more games.
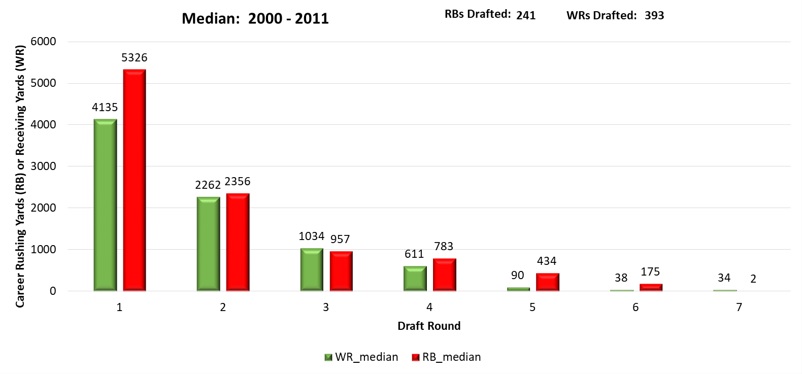
Running backs and wide receivers are an interesting comparison. In the first round, the WRs last 16 games longer, but second through fourth rounds are within a couple of games. Looking at the career rushing and receiving yards for these positions yields some other interesting observations. First round RBs far out-produce their WR counterparts, but by the second round, they are very close in production. From there, they stay pretty close, with fifth round RBs having a bit of an edge. Anything past the fourth round has very little production. This might be the most surprising thing I came across.
The common refrain is not to draft RBs in the first round, you can find them anywhere, and they’re fungible. No one batted an eye when three WRs went in the top 10 picks this year. So I was pretty surprised to see that the median first round RB out produced the first round WR. Even more surprising was that RB production fell off quicker than the WR production. This doesn’t account for any other factors, like how impactful each position is or anything of that nature, but I was pretty surprised by this overall.
All else being equal (which it probably isn’t) this data suggests that if you needed both a RB and a WR, to take the RB in the first. The first round RB out produces the first round WR, and the second round WR is less of a drop off from the first round WR than is the second round RB. Very interesting to me.
So how do the Steelers RB selections stack up against these trends? I’ve tabulated all the Steelers’ RB picks from 2000-2020 in the table below, and compared them to the median numbers for their draft rounds (based on 2000-2011 draft data). In total, they came in 116 games under the median, largely due to Rainey and Archer. Mendenhall walking away from the game early also had a big impact here. For yards, they came in 3,564 yards over, with Bell doing the heavy lifting at 4,097 yards over the median himself. Conner had a respectable 1,346 yards over median.
Perhaps most interesting is Samuels and Snell both pretty much right at median already. If Samuels’ NFL career ends this offseason, he will have been a pretty typical fifth round RB, with 42 games and 459 rushing yards. Snell is short in the games department, but just a hair over the median rushing yards. If he sticks around as a backup a few more years, he’ll have been a decently better than typical fourth round RB.
| Year | Rnd | Player | G | G O/U Median | Yds | Yds O/U Median | % RBs with Less Yards |
| 2002 | 5 | Verron Haynes | 68 | 20 | 738 | 304 | 63% |
| 2003 | 7 | J.T. Wall | 0 | -10.5 | 0 | -2 | 2% |
| 2005 | 7 | Noah Herron | 23 | 12.5 | 273 | 271 | 77% |
| 2006 | 7 | Cedric Humes | 0 | -10.5 | 0 | -2 | 2% |
| 2008 | 1 | Rashard Mendenhall | 72 | -24 | 4236 | -1090 | 42% |
| 2009 | 5 | Frank Summers | 27 | -21 | 63 | -371 | 21% |
| 2010 | 6 | Jonathan Dwyer | 38 | 16.5 | 1022 | 847 | 83% |
| 2011 | 7 | Baron Batch | 12 | 1.5 | 49 | 47 | 58% |
| 2012 | 5 | Chris Rainey | 18 | -30 | 102 | -332 | 38% |
| 2013 | 2 | Le’Veon Bell | 88 | 7.5 | 6453 | 4097 | 86% |
| 2014 | 3 | Dri Archer | 20 | -30 | 40 | -917 | 7% |
| 2017 | 3 | James Conner | 50 | 0 | 2302 | 1346 | 64% |
| 2018 | 5 | Jaylen Samuels | 42 | -6 | 459 | 25 | 50% |
| 2019 | 4 | Benny Snell Jr. | 29 | -12 | 794 | 11 | 51% |
| 2020 | 4 | Anthony McFarland Jr. | 11 | -30 | 113 | -670 | 27% |
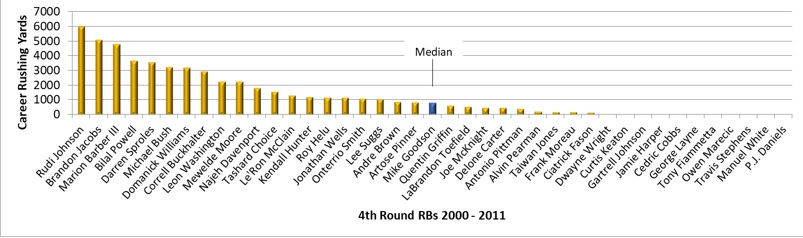
This puts into perspective the type of performance from mid to late round RBs you can realistically expect. You can find good RBs in the fourth round; Rudi Johnson of the Bengals put up 5,979 career rushing yards (most for fourth rounders 2000-2011). But half of the RBs taken in the fourth gained less than 783 career yards. I plotted the career rushing yards of the 41 fourth round RBs to give a better picture of what the distribution looks like. There are a decent number of productive RBs taken in the fourth, but there are more that do very little in the NFL.
I hope some of this was interesting to you. I personally found it a good exercise to see what type of production comes from each round, and to see what other teams are doing at the position. We tend to focus on what the successful picks do, and forget about the failures. Let me know what you think, or if you have any questions about what I’ve put together here.