With the Super Bowl approaching, it is not surprising that many in the football universe are discussing the fact that the Kansas City Chiefs and the Tampa Bay Buccaneers are the league-leaders in total passing yards (the Chiefs with 4,854 and the Buccaneers with 4,626). Moreover, both teams are out of the top-15 in total rushing yards. The Chiefs rank 16th in the NFL with 1,799 while the Buccaneers are in the bottom five at 28th with 1,519.
The suggested implications within that data are clear: the NFL is, now more than ever, a quarterback’s game and those units with high-powered air attacks are more than likely to advance deep into the playoffs.
Indeed, Michael DeCourcy from SportingNews.com agrees:
As the Pittsburgh football community continues to fetishize the running game like it’s 1976 — that goes all the way to the top, mind you — the No. 16 and No. 28 teams in rushing will meet in #SuperBowlLV
(They were No. 1 and No. 2 in passing. Yep.)— Michael DeCourcy (@tsnmike) January 29, 2021
In that single tweet, DeCourcy is implying two things.
First, he is making an argument that the Pittsburgh Steelers – or their fans, specifically – should stop obsessing over the running game as this year’s Super Bowl teams are not even in the top ten of total rushing yards.
Second, DeCourcy is arguing that an offensive focus should be placed heavily on the passing attack, as the Buccaneers survived having one of the worst rushing offenses in the league via the strength and accuracy of Tom Brady’s right arm.
I am here to tell you that DeCourcy’s argument, while not incorrect, is slightly misguided. While the passing game in the NFL has certainly increased in importance, comparing it to total rushing yardage is unwise as not all rushing yards are created equal.
The goal of this piece is two-fold:
- To highlight that gauging a team’s rushing attack by total yardage is not as effective as gauging by rushing success rate.
- To examine how important a successful passing game is in the modern NFL.
To start, let us jump into total rushing yardage versus rushing success rate.
DeCourcy structures his argument around total passing yards versus total rushing yards. While not as outrageously misleading a statistic as yards per carry, total rushing yards does not tell the entire story much like total passing yards is but a small piece of the puzzle in evaluating a quarterback’s passing game.
In other words, one should not dismiss the importance of a rushing attack in the NFL just because this year’s Super Bowl teams are tops in passing, but in the bottom half of rushing.
To validate my argument, I turned to data analytics to construct a rushing success rate model. The specific model used was introduced by Chase Stuart over at FootballPerspective.com but, by using the R programming language and the associated nflfastR package, I can perform the calculations in seconds and over all seasons dating back as far as 2009. Though, in this study, only the 2010 to 2020 seasons are used.
To get started, let us first discuss the structure of the rushing success rate model. To do so (and for the sake of transparency), here is a look at the coding done behind the scenes to make it possible and, after, what it all means.
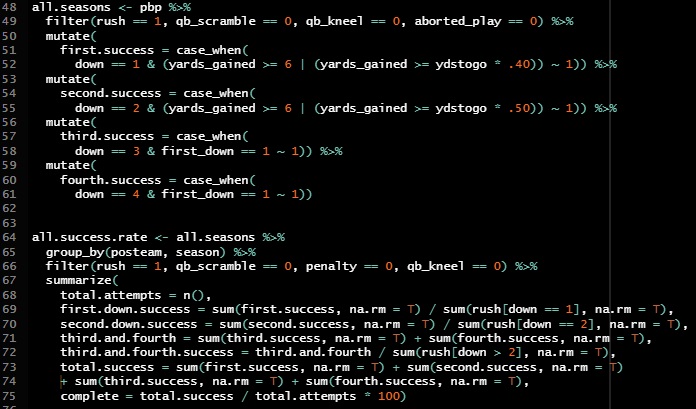
The rushing success rate model is structured around three scenarios consisting of rushes on first down, second down, and then third and fourth down combined. On first down, a rush is considered successful if it either gains six yards or more, or the yardage gained is at least 40-percent of the required yards needed.
On second down, the requirements are the same, except the rusher must get 50-percent of the required yards for a first down.
On third and fourth downs, a rush is considered a success only if a first down is achieved. As you can see in the screenshot of the included code, the information is being filtered to exclude quarterback scrambles, quarterback kneels, and aborted plays.
After that information is computed and inserted into the existing play-by-play file containing the information for every rushing play from 2010 to 2020, a little bit of simple mathematics gets the end success rate results. For example, for first down success rate, the code is taking the total number of runs deemed as successful from above and then dividing that by the total amount of attempts that meet that criteria. Pretty simple stuff.
In the end, as explained by Stuart, rushing success rate is the running game’s analog to the completion percentage in the passing game. Moreover, it explains how often a team is getting important yards on the ground.
By running a simple analysis on just the 2020 season data, we can instantly see why DeCourcy’s argument in his tweet is not telling the complete story and why total rushing yards is a misleading statistic.
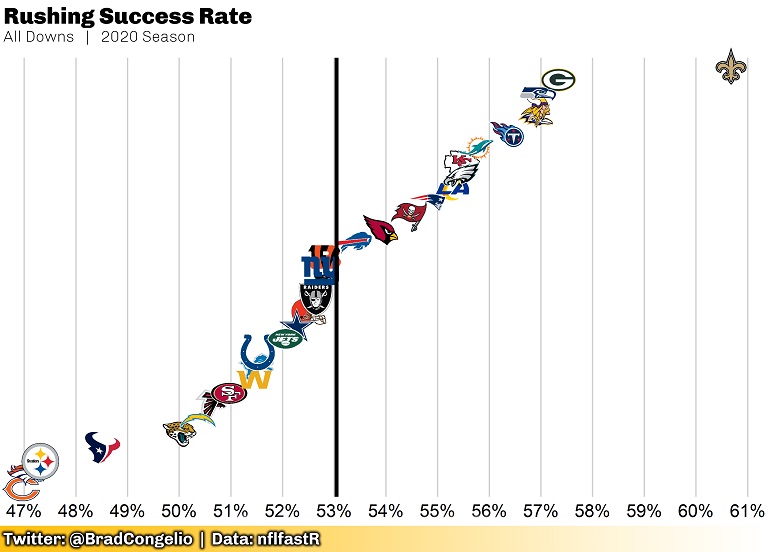
The Chiefs’ total rushing success rate – meaning over all downs – was 55.5-percent. The Buccaneers? A respectable 54.4-percent. Those rushing success rate percentages were good enough to finish the regular season in 8th and 12th place, respectively.
Remember: the Chiefs finished 16th in the NFL in total rushing yards and the Buccaneers finished 28th. In both cases, the teams, while not having spectacular seasons based on total yardage, earned important yards on the ground often enough to largely keep pace with the success rate leaders in the NFL.
What about on specific downs?
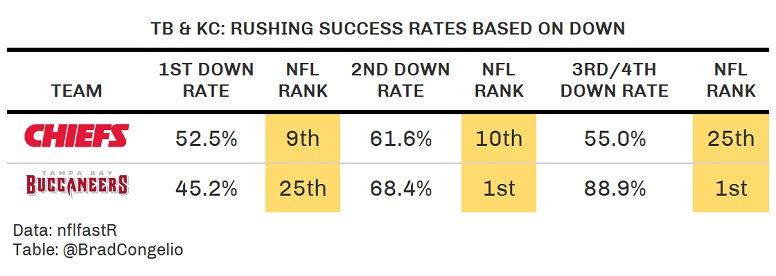
While Kansas City does have one of the worst success rates on 3rd and 4th downs, it is otherwise in the top ten in the league on first and second down success rate. The Buccaneers, while struggling on first, are the best rushing team in the NFL on both second down and third and fourth. In fact, Tampa Bay is a whole 16-percent better than the second-place team on the combined third and fourth down attempts (the New Orleans Saints).
Again: the construction of the model to gauge rushing success rate seems to indicate that relying on total rushing yardage as the barometer of running success is misguided.
However, DeCourcy’s argument is that the Chiefs’ and Buccaneers’ passing games are the reason both teams will be competing in the Super Bowl.
To examine how true that is, we can compare rushing success rate (across all downs) to a team’s ANY/A. As well, by utilizing the espnscrapeR package in R (developed by @Thomas_Mock) we can also include the total number of a team’s playoff appearances since 2010:
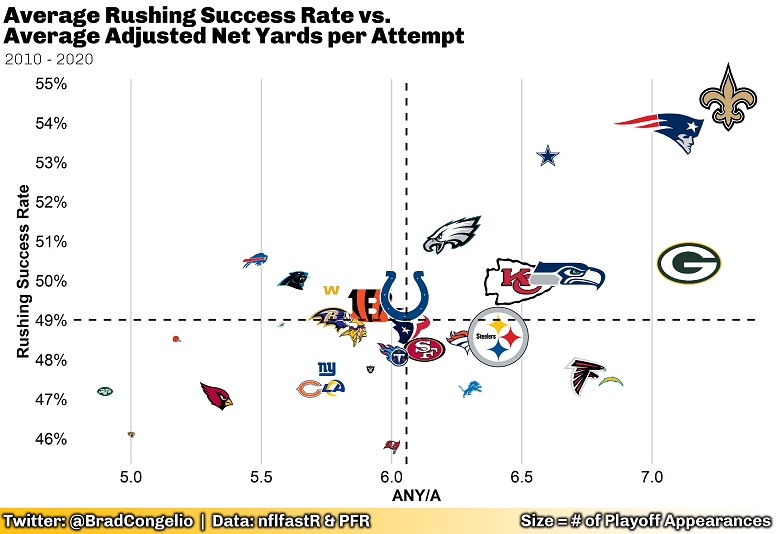
The plot indicates that while an above-average rushing success rate is an important piece of the puzzle, many of the teams with the highest number of playoff appearances since 2010 – as indicated by the size of the team logo – start to distance themselves from those with less appearances when it comes down to ANY/A.
However, it is hard to draw any concrete solutions from the plot. Instead, we turn to a more statistical approach. A simple multiple linear regression analysis can provide a much more clear answer. In this case, we will take all the scenarios baked into the rushing success rate model and ANY/A and run those against all 32 team’s winning percentages from 2010 to 2020.
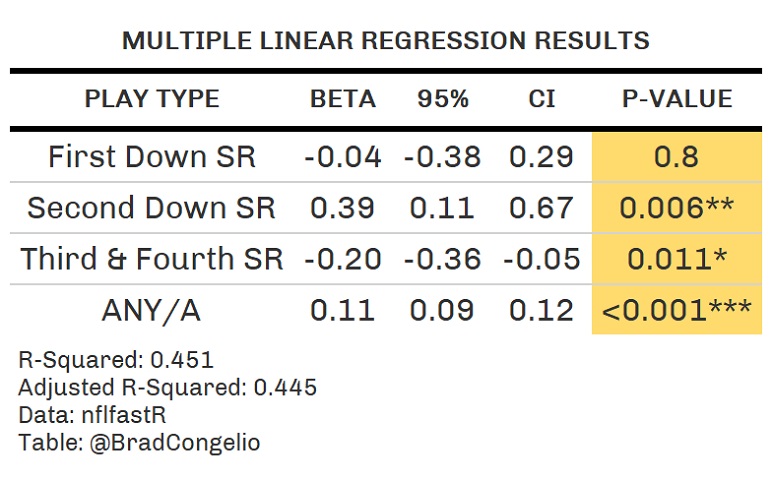
The results of the multiple linear regression are clear, in my opinion.
To start, here is an explainer on what the numbers mean. The p-value, in short, explains the significance of the relationship between each independent variable to the dependent variable. The lower the p-value the better.
In this case, ANY/A has a very significant relationship in determining winning percentage. In fact, the p-value of <0.001 indicates that data is less than one in a thousand chance of being incorrect. Second down success rate and third/fourth down success rate also have a relationship with the dependent variable, but no where near as strong as ANY/A. Surprisingly, this linear regression model argues that first down rushing success rate had little impact on winning percentage over the last ten years.
The r-squared and adjusted r-squared numbers at the bottom are important as well. The r-squared numbers are a statistical measure of the goodness-of-fit of the regression model. It represents the proportion of the variance that is ultimately explained by the independent variables. In this case, rushing success rate and ANY/A explain roughly 45-percent of the variance in winning percentage.
The regression analysis indicates that the passing game – as measured by ANY/A – is far more important to winning percentage than rushing success rate (with the caveat that these variables explain just 45-percent of the overall variance in winning percentage over the last ten season).
Now, we circle back to the beginning to bring this to an end.
DeCourcy’s tweet was not inherently wrong. The Chiefs and Buccaneers do have weak rushing attacks if you look at them purely from total rushing yards. However, total rushing yards is a rather archaic way of examining a team’s ground game.
Instead, a heavier focus should be placed on rushing success rate, as it is a better gauge of how important the yardage is that a team is picking up on the ground.
That said: one cannot ignore the overall importance of the passing game, which – according to DeCourcy – is vastly more important than the rushing game. In that sense, he is correct. Even though rushing success rate is a better metric in which to judge that portion of a team’s offense, a simple multiple linear regression shows that ANY/A is highly influential on a team’s overall winning percentage compared to rushing success rate.


