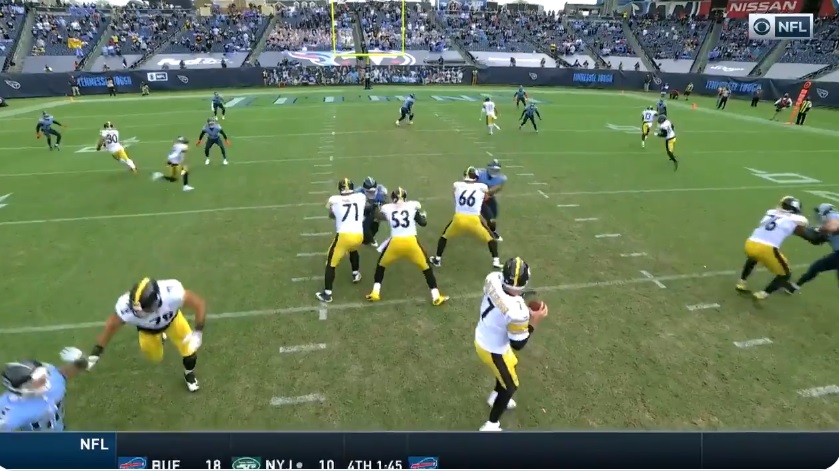
Following Alex Kozora’s lead with the defensive charting I am here to bring you some numbers about the offense. The following data is based on our hand-done offensive charting. If there are any numbers we you’d like to see, let us know in the comments and we’ll look it up (if we track it.)
Through 8 games the offense has been on the field for 557 plays an average of 69.6 plays per game. This includes 57 plays that had penalties and 14 snaps in the victory formation. For comparison in the 2019 season the Steelers had 1,019 plays (63.7 per game) that included 116 penalties and 15 snaps in the victory formation.
2020 Personnel Grouping
| Personnel Group | Positions | Count of Plays | % of Total Plays | Runs | Completions | Incompletions | Miscellaneous |
| 01 | 1 TE/ 4 WR | 51 | 9.2% | 0 | 35 | 14 | 2 |
| 10 | 1 RB/ 4 WR | 1 | 0.2% | 0 | 1 | 0 | |
| 11 | 1 RB/ 1TE/ 3 WR | 336 | 60.3% | 108 | 139 | 69 | 20 |
| 12 | 1 RB/ 2 TE/ 2 WR | 84 | 15.1% | 39 | 25 | 16 | 4 |
| 13 | 1 RB/ 3 TE/ 1 WR | 27 | 4.8% | 23 | 3 | 0 | 1 |
| 14 | 1 RB/ 4 TE | 1 | 0.2% | 1 | 0 | 0 | 0 |
| 20 | 2 RB/ 3 WR | 1 | 0.2% | 1 | 0 | 0 | 0 |
| 21 | 2 RB/ 1 TE/ 2 WR | 2 | 0.4% | 1 | 0 | 1 | 0 |
| 22 | 2 RB/ 2 TE/ 1 WR | 37 | 6.6% | 29 | 4 | 4 | 0 |
| 23 | 2 RB/ 3 TE | 3 | 0.5% | 2 | 0 | 1 | 0 |
| V32 | 3RB/ 2 TE | 14 | 2.5% | 14 | |||
| Totals | 557 | 204 | 207 | 105 | 41 |
No surprise here that 11 personnel is the most used followed by 12 personnel. Interesting that 01 personnel is the third most used personnel grouping when you consider prior to week 8 against Baltimore they had only used that grouping for six plays in week 5.
The miscellaneous column includes sacks, aborted plays, interceptions, scrambles and no plays. The V32 personnel or victory formation consists of kneel downs at the end of half or game.
- The No Huddle offense has been used for 57 total plays with 14 plays having zero or negative yards and 20 plays gaining 10+. Overall no huddle has garnered 461 net yards (included yards from penalties) for an average of 8.09 yards per play. There were 6 runs and 51 drop backs with 38 completions, 11 incompletions, 3 touchdowns and 2 sacks.
- Play action has been used for a mere 33 plays and has 10 plays of zero or negative yards. These plays gained 129 net yards for an average of 3.91 yards per play. There were 18 completions, 14 incompletions and one sack. Not very productive overall.
- The Canada Effect – There have been 223 uses of shift or motion thus far. That is 40% of the plays. There were 101 plays (18% of total plays) that had a player in motion at the snap of the ball led by Chase Claypool (44), James Washington (20) and Diontae Johnson and Ray-Ray McCloud each with 12.
Quarterbacks
Snap totals have Ben Roethlisberger with 545 snaps with 416 (74.5%) of those coming in shotgun. Mason Rudolph has 11 snaps with 7 (63.6%) coming in shotgun.
- Where does Roethlisberger throw the ball? When charting passes the field is broken up into five sections. Here is breakdown of his attempts.
Outside the numbers to the left – 87
From the numbers to the left hash – 57
Between the hash marks – 49
From the right hash to the numbers – 69
Outside the numbers to the right – 61
- Roethlisberger has 68 completions on first down, 69 on second down, 59 on third down and 2 on fourth down. He also has one completion on a two point conversion.
- Roethlisberger has faced a blitz on 89 plays. He is 52 of 87 with 562 yards with 4 TD’s, 1 interception and has been sacked twice. They also drew two defensive pass interference penalties the garnered 36 yards.
Where are passes being thrown? This chart shows where the passes are being thrown, the net yards on those passes and the average net yards per completion and per attempt. Deep passes reflect throws 15+ yards down field.
| Direction | Completions | Attempts | Net Yards | Avg/Comp | Avg/Att |
| Deep Left | 8 | 19 | 283 | 35.38 | 14.89 |
| Deep Middle | 5 | 12 | 144 | 28.80 | 12.00 |
| Deep Right | 5 | 29 | 196 | 39.20 | 6.76 |
| Short Left | 80 | 105 | 712 | 8.90 | 6.78 |
| Short Middle | 60 | 79 | 468 | 7.80 | 5.92 |
| Short Right | 46 | 69 | 288 | 6.26 | 4.17 |
Running Backs
The vast majority of snaps have obviously gone to James Conner but how does the team do when each RB is on the field. Here is a look at the average yards per play the offense produced when each RB is on the field. This includes plays when more than one RB was on the field and I removed snaps in the victory formation.
| Player | # of Plays | Runs | Run Yards | Yards per Run | Pass Plays | Pass Yards | Yards per Pass |
| Benny Snell | 86 | 52 | 185 | 3.56 | 34 | 198 | 5.82 |
| Anthony McFarland | 35 | 20 | 96 | 4.80 | 15 | 62 | 4.13 |
| James Conner | 337 | 130 | 615 | 4.73 | 207 | 1068 | 5.16 |
| Jaylen Samuels | 49 | 11 | 26 | 2.36 | 38 | 246 | 6.47 |
| Derek Watt | 25 | 18 | 106 | 5.89 | 7 | -1 | -0.14 |
The Samuels pass yard numbers surprised me a bit but again this was how the entire offense produced not just the running back.
Where the running back runs the ball has an effect as well. Some runners are better on the outside rather than inside. Next we’ll look at the production by direction.
| Direction | Snell | McFarland | Conner | Samuels | Average |
| Left End | 3.50 | 0.50 | 5.20 | N/A | 4.29 |
| Left Tackle | 5.13 | 4.00 | 1.79 | N/A | 3.15 |
| Left Guard | 0.17 | 7.33 | 5.26 | N/A | 4.74 |
| Middle | 2.55 | 1.00 | 3.26 | N/A | 2.95 |
| Right Guard | 3.00 | 0.00 | 2.70 | 1.00 | 2.65 |
| Right Tackle | 2.40 | 2.00 | 7.81 | 2.00 | 5.96 |
| Right End | 8.33 | 21.00 | 3.78 | 5.00 | 6.47 |
There are some interesting numbers here. The average yardage up the middle and over the right guard, behind Maurkice Pouncey and David DeCastro is surprisingly low. Snell has been best running outside to right with 50 yards on six carries. McFarland had one big run outside to the right but has been very good over the left guard. Conner has his best production is over the right tackle, left guard and left end
Wide Receivers
It has been a good year so far for the wide receivers. Everyone has had a chance to produce making it difficult for defenses to focus on one player. Juju Smith-Schuster has provided the tough yards in the middle of the field. Diontae Johnson is most impressive after the catch. Chase Claypool has done a little bit of everything and James Washington is a strong deep threat. Ray-Ray McCloud has added a speed element to the offense and deserves more snaps going forward. So let’s begin with where the receivers line up.
| Player | Wide Left | Slot Left | Slot Right | Wide Right | Other |
| Claypool | 95 | 56 | 98 | 92 | 22 |
| Washington | 84 | 44 | 59 | 80 | 3 |
| McCloud | 18 | 27 | 37 | 9 | 0 |
| Johnson | 108 | 59 | 48 | 88 | 0 |
| Smith-Schuster | 27 | 164 | 234 | 21 | 6 |
It’s no surprise Smith-Schuster is in the slot 88% of the time. Washington 62% and Johnson 65% are mostly used outside. Claypool is split most evenly with 55% outside and 45% inside.
Johnson is most frequently targeted with one of every 5.61 snaps he plays. He is followed by Claypool (7.72), Smith-Schuster (7.93), Washington (9.00) and McCloud (10.11).
The next grid shows where the WR’s are targeted across the field. These numbers include the targets on plays that had penalties.
| Target Location | Claypool | Washington | McCloud | Johnson | Smith-Schuster |
| Outside #’s Left | 14 | 10 | 4 | 18 | 13 |
| Left #’s to Hash | 6 | 5 | 1 | 12 | 15 |
| Between the Hashes | 4 | 2 | 3 | 4 | 8 |
| Right hash to #’s | 14 | 3 | 1 | 10 | 17 |
| Outside #’s Right | 19 | 13 | 1 | 11 | 9 |
Claypool (58%) and Washington (70%) are heavily targeted outside the numbers and Smith-Schuster (65%) does his work inside the numbers. Between the hashes is a small area where Johnson isn’t often used with only 7% of his targets coming in the very middle of the field.
Tight Ends
Eric Ebron was brought in this year to be a bigger pass threat in the offense and unlike past years they are throwing to the tight end. He has 43 targets thus far and 3 touchdowns. The snap count for he and Vance McDonald has been pretty consisted all season with Ebron getting 61% and McDonald 39% with them both being on the field for 152 snaps (27.3%) .
With two or more tight ends on the field they have ran the ball 94 times (63%) and have ran a pass play 56 times (37%) with two plays aborted. The running plays have average 4.46 net yards per play and the pass plays have averaged 5.05 net yards per play.
When only one of the tight ends is on the field the running game numbers aren’t a surprise. With McDonald on the field they average net 4.52 yards on runs while with Ebron as the only TE they average 3.74 net yards per running play.
On all passing plays the edge goes to Ebron but it wasn’t as big of a gap as you might think. Ebron was in on 272 passing plays in which the team averaged 6.24 net yards per play and for McDonald he was in on 111 plays that number was 5.54 net yards per play.
Based on tight end targets the ball gets spread around pretty well. Across each section of the field the numbers are pretty consistent with the best average gain coming right down the middle and outside the numbers to the left.
| Target Location | Ebron | Net Yards | Yards/Target | McDonald | Net Yards | Yards/Target |
| Outside #’s Left | 11 | 84 | 7.64 | 4 | 29 | 7.25 |
| Left #’s to Hash | 7 | 44 | 6.29 | 2 | 11 | 5.50 |
| Between the Hashes | 8 | 73 | 9.13 | 2 | 17 | 8.50 |
| Right hash to #’s | 12 | 47 | 3.92 | 2 | 4 | 2.00 |
| Outside #’s Right | 7 | 45 | 6.43 | 1 | 0 | 0.00 |
| Grand Total | 45 | 293 | 6.51 | 11 | 61 | 5.55 |
Offensive Line
Through eight games the Steelers have used eleven different offensive linemen at some point this season.
Snap Counts
Alejandro Villanueva – 557 (has played every offensive snap)
Maurkice Pouncey – 544
Matt Feiler – 554
Chukwuma Okorafor – 498
David Decastro – 305
Kevin Dotson – 194
J.C Hassenauer – 13
Stefen Wisniewski – 64
Zach Banner – 60
Jerald Hawkins – 51
Derwin Gray – 3
The Steelers usage of an extra lineman got much attention last year with the love from fans for Zach Banner. In 2019 he was used 92 times as the extra lineman in the first 8 games with 75% of time him being on the right. Through eight games in 2020 they have used the tackle eligible for 48 plays starting with Okorafor (5 times), Hawkins (43) and Dotson (1). They put the extra lineman on the right side 83.4% of the time and used one on each side once.
With the extra lineman the Steelers have run the ball 41 times for 114 net yards (2.78 yards per play) and have thrown the ball 8 times for 88 net yards with Roethlisberger going 4 of 7 for 68 yards with a defensive pass interference penalty that gained 29 yards and one intentional grounding penalty that cost 9 yards.


