Part 3: Defensive Performance and Net Effectiveness
In 2019, the Tampa Bay Buccaneers were considered to have a bad defense by many statistics, mainly owing to a really bad pass defense. They were the 29th defense by points allowed according to Pro Football Reference, but they were only the 15th defense by yardage. Digging deeper into the yardage numbers, the Bucs had the best run defense (by yards given up) while the 24th best pass defense. This being said, the Bucs defense also had to contend with an offense (as mentioned in the previous article) which had a bad habit of turning the ball over (most lost turnovers in the league, with 17% more turnovers than the second ranked team). Similarly, the Steelers defense dealt with an anemic offense (5th in turnovers lost). Could adjusting the performance of the defense by field position tell us something different about how the team actually performed?
Using the same calculation completed in the previous article (using data from Pro Football Reference), except sorted by the defending teams, the distribution of cPoints (see Figure 1 and Table 1) again reveals some differences compared to rankings by points and yards. Just as with the offensive cPoints distribution where the Ravens were the top offense last year, the Patriots defense was the best in the NFL by a wide margin and led in cPoints just as they led in both points and yards allowed. In fact, by the normalized difference in cPoints, the Patriots (dark blue in figure 2) were further away from the second ranked team than the Ravens offense.
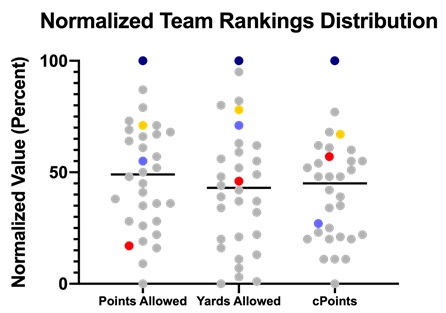
Figure 1 – Distribution of Team Defensive Rankings by Points Allowed, Yards, and cPoints (Dark Blue = Patriots, Gold = Steelers, Lighter Blue = Chargers, Red = Bucaneers)
The Steelers (gold in figure 1) defense performed very strongly, and despite their struggles early in the year, were the 6th and 5th best defense by points and yards allowed respectively. By cPoints they were actually the 4th best defense. Not all teams remained similarly ranked by cPoints. The Chargers (light blue in figure 1) had the 14th and 6th best defense by points and yards allowed respectively but the 21st overall defense by cPoints. Finally, the Buccaneers (red in figure 1) rose up from the 29th and 15th best defense by points and yards allowed respectively to the 8th best defense by cPoints. There were a couple other defenses that also were rated much higher (Packers, Saints) and lower (Raiders, Cowboys) by cPoints compared to the more often presented points allowed and yards allowed.
Table 1 – Ranking of Defensive Team Performance by cPoints in 2019
| Raw Totals | Ranking | Difference in Rankings | ||||||
| Team | Points Allowed | Yards Allowed | cPoints | Points Allowed | Yards Allowed | cPoints | Total scoring vs. cPoints | Total yards vs. cPoints |
| New England Patriots | 225 | 4,414 | -190.9 | 1 | 1 | 1 | 0 | 0 |
| Buffalo Bills | 259 | 4,772 | -126.5 | 2 | 3 | 2 | 0 | 1 |
| San Francisco 49ers | 310 | 4,509 | -100.1 | 8 | 2 | 3 | 5 | -1 |
| Pittsburgh Steelers | 303 | 4,866 | -98.0 | 6 | 5 | 4 | 2 | 1 |
| Green Bay Packers | 313 | 5,642 | -84.0 | 9 | 18 | 5 | 4 | 13 |
| Baltimore Ravens | 282 | 4,809 | -81.1 | 3 | 4 | 6 | -3 | -2 |
| New Orleans Saints | 341 | 5,329 | -75.8 | 13 | 11 | 7 | 6 | 4 |
| Tampa Bay Buccaneers | 449 | 5,503 | -67.3 | 29 | 15 | 8 | 21 | 7 |
| Chicago Bears | 298 | 5,186 | -63.2 | 4 | 8 | 9 | -5 | -1 |
| Denver Broncos | 316 | 5,392 | -62.4 | 10 | 12 | 10 | 0 | 2 |
| Los Angeles Rams | 364 | 5,434 | -59.3 | 17 | 13 | 11 | 6 | 2 |
| Tennessee Titans | 331 | 5,752 | -54.7 | 12 | 21 | 12 | 0 | 9 |
| Minnesota Vikings | 303 | 5,465 | -52.6 | 5 | 14 | 13 | -8 | 1 |
| New York Jets | 359 | 5,170 | -43.8 | 16 | 7 | 14 | 2 | -7 |
| Philadelphia Eagles | 354 | 5,307 | -43.1 | 15 | 10 | 15 | 0 | -5 |
| Kansas City Chiefs | 308 | 5,594 | -42.4 | 7 | 17 | 16 | -9 | 1 |
| Dallas Cowboys | 321 | 5,232 | -27.2 | 11 | 9 | 17 | -6 | -8 |
| Indianapolis Colts | 373 | 5,549 | -18.8 | 18 | 16 | 18 | 0 | -2 |
| Seattle Seahawks | 398 | 6,106 | -7.2 | 22 | 26 | 19 | 3 | 7 |
| Cleveland Browns | 393 | 5,785 | -2.4 | 20 | 22 | 20 | 0 | 2 |
| Los Angeles Chargers | 345 | 5,009 | 16.9 | 14 | 6 | 21 | -7 | -15 |
| Jacksonville Jaguars | 397 | 6,007 | 23.5 | 21 | 24 | 22 | -1 | 2 |
| Atlanta Falcons | 399 | 5,693 | 26.7 | 23 | 20 | 23 | 0 | -3 |
| Detroit Lions | 423 | 6,406 | 29.8 | 26 | 31 | 24 | 2 | 7 |
| New York Giants | 451 | 6,037 | 33.3 | 30 | 25 | 25 | 5 | 0 |
| Washington Football Team | 435 | 6,162 | 35.1 | 27 | 27 | 26 | 1 | 1 |
| Houston Texans | 385 | 6,213 | 35.2 | 19 | 28 | 27 | -8 | 1 |
| Cincinnati Bengals | 420 | 6,299 | 35.7 | 25 | 29 | 28 | -3 | 1 |
| Arizona Cardinals | 442 | 6,432 | 61.3 | 28 | 32 | 29 | -1 | 3 |
| Carolina Panthers | 470 | 5,992 | 61.4 | 31 | 23 | 30 | 1 | -7 |
| Oakland Raiders | 419 | 5,677 | 61.9 | 24 | 19 | 31 | -7 | -12 |
| Miami Dolphins | 494 | 6,364 | 93.4 | 32 | 30 | 32 | 0 | -2 |
Trying to qualitatively group the defenses by cPoints distribution like in the previous article (see Figure 2) was a little more difficult, as the Patriots’ extreme dominance (and to a lesser degree the Dolphins defense’s weakness) squeezed the middle of the distribution together a lot more. This showed itself especially in the distribution of Pro Bowl players (prior to alternates being named), where because the top three groups were held by four teams total, no relationship was visibly present.
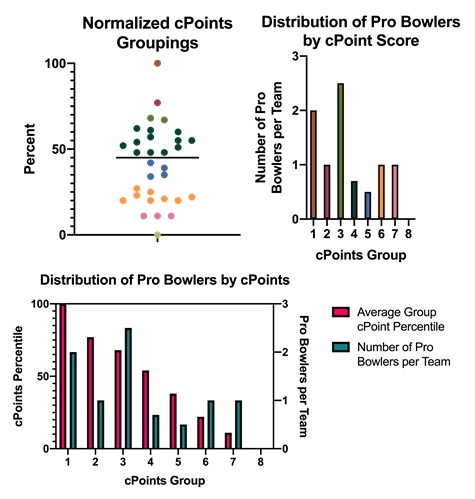
Figure 2 – Grouping of teams by defensive cPoints and its relationship to the number of defensive pro bowlers
Looking individually at cPoint performance and defensive pro bowler distribution granularly (see Table 2), there is much more seemingly random distributions. For example, the Patriots only had 2 Pro Bowl players (the same amount as the Cardinals who were the 4th worst defense). The Ravens defense, the 6th best defense by cPoints had the most pro bowlers (4). Notably, the Chargers, which cPoints was more critical of, were tied for the second most pro bowlers (3) with the Steelers.
Table 2 – cPoint Grouping and Defensive Pro Bowlers (before alternates)
| Team | Normalized cPoints | cPoint Group | Number of Defensive Pro Bowlers |
| New England Patriots | 100% | 1 | 2 |
| Buffalo Bills | 77% | 2 | 1 |
| San Francisco 49ers | 68% | 3 | 2 |
| Pittsburgh Steelers | 67% | 3 | 3 |
| Green Bay Packers | 62% | 4 | 0 |
| Baltimore Ravens | 61% | 4 | 4 |
| New Orleans Saints | 60% | 4 | 2 |
| Tampa Bay Buccaneers | 57% | 4 | 1 |
| Chicago Bears | 55% | 4 | 2 |
| Denver Broncos | 55% | 4 | 1 |
| Los Angeles Rams | 54% | 4 | 0 |
| Tennessee Titans | 52% | 4 | 0 |
| Minnesota Vikings | 51% | 4 | 2 |
| New York Jets | 48% | 4 | 0 |
| Philadelphia Eagles | 48% | 4 | 1 |
| Kansas City Chiefs | 48% | 4 | 2 |
| Dallas Cowboys | 42% | 5 | 0 |
| Indianapolis Colts | 39% | 5 | 1 |
| Seattle Seahawks | 35% | 5 | 1 |
| Cleveland Browns | 34% | 5 | 0 |
| Los Angeles Chargers | 27% | 6 | 3 |
| Jacksonville Jaguars | 25% | 6 | 1 |
| Atlanta Falcons | 23% | 6 | 1 |
| Detroit Lions | 22% | 6 | 1 |
| New York Giants | 21% | 6 | 1 |
| Washington Football Team | 20% | 6 | 0 |
| Houston Texans | 20% | 6 | 0 |
| Cincinnati Bengals | 20% | 6 | 1 |
| Arizona Cardinals | 11% | 7 | 2 |
| Carolina Panthers | 11% | 7 | 1 |
| Oakland Raiders | 11% | 7 | 0 |
| Miami Dolphins | 0% | 8 | 0 |
With both the offensive and defensive cPoints in hand, the final aim was to combine them into a singular metric. Given that the cPoints have already been normalized, I ended up calculating the total cPoints by just adding together the offensive and defensive cPoint percentiles, with the possible range being between 0 and 200. Graphing that distribution compared to each team’s winning percentage (see Figure 3), a relationship is visible (R2 = 0.746), where the teams with the best record had the best cPoints. It is interesting to note the cluster of 5 teams in the 4 dots in the upper right (Saints and the 49ers occupy the same spot) contained both super bowl teams. On the other end of the spectrum, the Bengals occupied the bottom left, with the second worst cPoints and the worst record.
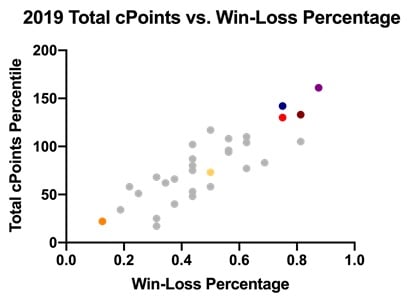
Figure 3 – Total cPoints vs. 2019 record. (Purple = Ravens, Blue = Patriots, Dark Red = 49ers, Light Red = Chiefs, Gold = Steelers, Orange = Bengals)
Even though the Steelers’ defense performed stellar last year (67%, 4th overall), they were only ranked in the middle of the distribution because of how bad the offense performed (5%, 28th overall). With any luck, the Steelers offensive performance next year will at least be around 50% with the return of Ben, and with the defense expected to repeat its previous score, that would place the team at ~120%, well within striking distance of the 130% mark of last year’s super bowl winners.
Overall, the 2020 NFL season will be a unique one for the ages, but it may give an opportunity to look again with fresh eyes at the performance of both the Steelers, and other teams around the league. Whether or not the Steelers are able to win it all may be uncertain, but perhaps along the way we should begin to think further about whether it is time to correct our scoring.
Table 3 – Total cPoints Rankings compared to 2019 record
| Raw Values | cPoints | ||||||
| Team | W | L | W-L% | Offensive cPoints Percent | Defensive cPoints Percent | Total cPoints Percent | Ranking Total cPoints |
| Baltimore Ravens | 14 | 2 | 0.875 | 100% | 61% | 161% | 1 |
| Green Bay Packers | 13 | 3 | 0.813 | 43% | 62% | 105% | 9 |
| New Orleans Saints | 13 | 3 | 0.813 | 73% | 60% | 133% | 3 |
| San Francisco 49ers | 13 | 3 | 0.813 | 65% | 68% | 133% | 3 |
| Kansas City Chiefs | 12 | 4 | 0.75 | 82% | 48% | 130% | 5 |
| New England Patriots | 12 | 4 | 0.75 | 42% | 100% | 142% | 2 |
| Seattle Seahawks | 11 | 5 | 0.688 | 48% | 35% | 83% | 15 |
| Houston Texans | 10 | 6 | 0.625 | 56% | 20% | 77% | 17 |
| Buffalo Bills | 10 | 6 | 0.625 | 27% | 77% | 104% | 10 |
| Minnesota Vikings | 10 | 6 | 0.625 | 59% | 51% | 110% | 7 |
| Philadelphia Eagles | 9 | 7 | 0.563 | 46% | 48% | 94% | 13 |
| Los Angeles Rams | 9 | 7 | 0.563 | 42% | 54% | 96% | 12 |
| Tennessee Titans | 9 | 7 | 0.563 | 56% | 52% | 108% | 8 |
| Chicago Bears | 8 | 8 | 0.5 | 3% | 55% | 58% | 23 |
| Pittsburgh Steelers | 8 | 8 | 0.5 | 5% | 67% | 73% | 19 |
| Dallas Cowboys | 8 | 8 | 0.5 | 75% | 42% | 117% | 6 |
| New York Jets | 7 | 9 | 0.438 | 0% | 48% | 48% | 27 |
| Oakland Raiders | 7 | 9 | 0.438 | 42% | 11% | 53% | 25 |
| Atlanta Falcons | 7 | 9 | 0.438 | 52% | 23% | 75% | 18 |
| Denver Broncos | 7 | 9 | 0.438 | 25% | 55% | 80% | 16 |
| Indianapolis Colts | 7 | 9 | 0.438 | 47% | 39% | 87% | 14 |
| Tampa Bay Buccaneers | 7 | 9 | 0.438 | 45% | 57% | 102% | 11 |
| Jacksonville Jaguars | 6 | 10 | 0.375 | 16% | 25% | 40% | 28 |
| Cleveland Browns | 6 | 10 | 0.375 | 32% | 34% | 66% | 21 |
| Arizona Cardinals | 5 | 10 | 0.344 | 51% | 11% | 62% | 22 |
| Miami Dolphins | 5 | 11 | 0.313 | 17% | 0% | 17% | 32 |
| Carolina Panthers | 5 | 11 | 0.313 | 14% | 11% | 25% | 30 |
| Los Angeles Chargers | 5 | 11 | 0.313 | 41% | 27% | 68% | 20 |
| New York Giants | 4 | 12 | 0.25 | 30% | 21% | 51% | 26 |
| Detroit Lions | 3 | 12 | 0.219 | 36% | 22% | 58% | 23 |
| Washington Football Team | 3 | 13 | 0.188 | 13% | 20% | 34% | 29 |
| Cincinnati Bengals | 2 | 14 | 0.125 | 2% | 20% | 22% | 31 |