Part 1: Kicker Performance
As the pitch bounced off the dirt and into the catcher’s mitt, the fans could see his disappointment from across the TV screen. Ball four was called and the batter walked to first to load the bases with the score tied at the bottom of the ninth. The manager walked up to the mound to begin the ritualistic process of switching pitchers to try to save the game. While the walk on music was loud and the fans were cheering, the reliever ultimately gave up a single and lost the game.
Although the baseball game was lost in the hands of that reliever, fans and the scorecard understand that the run given up and the loss is charged to the preceding pitcher. Should the same happen in football? Although, the circumstances are often different (you don’t have a quarterback in reserve to come in at the end of the game to spell Tom Brady), there are similar circumstances where simply taking the raw scoring may deceive the outcome. When we do this, then as a whole try to rank all 32 teams, do we miss some context?
Take for example last season when the Steelers were playing the Bills at home on Sunday night. A play after James Conner ran for 5 yards to convert a 2nd and 2 around midfield with around 2 minutes to go in the 3rd quarter, Duck Hodges threw a pick that was returned all the way to Pittsburgh’s own 18. The Steelers defense comes onto the field already in the redzone, and after 7 plays gives up a net of 0 yards to force the Bills to kick a 36-yard field goal. In many ways the Steelers defense preformed spectacularly yet was charged with giving up 3 points. In 2018, per pro football reference, NFL kickers make a kick from 33-37 yards away (corresponding to 16-20 yards from the endzone) 89% of the time (Table 1). Given the starting field position for the Bills, it was a gimmie field goal. Thus, the Steelers defense was essentially stuck in the role of that reliever I mentioned. Yes, the defense gave up points, but they held the Bills to a field goal which they were nearly doomed to from the start.
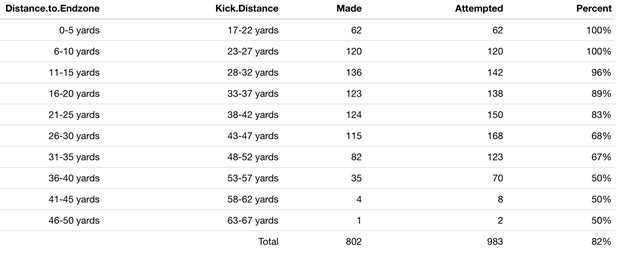
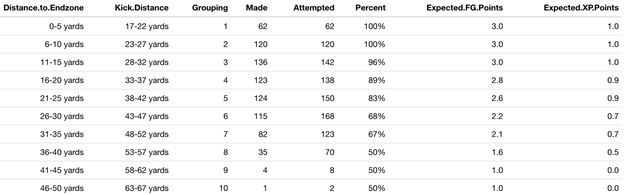
Table 1 – 2019 Field goal conversion rate by distance
If we were scoring with the perspective of a baseball fan, we should correct the points given up by the defense by where they started on the field. How about the offense as well? I would think most aspects of the game can be ranked. In this series, I will take an amateur’s look at how some of the team scoring statistics we follow as fans can shift when we try to take a look at correcting them for context. The first part will start with NFL kickers.
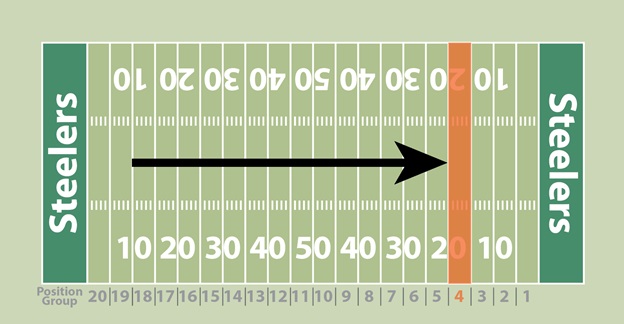
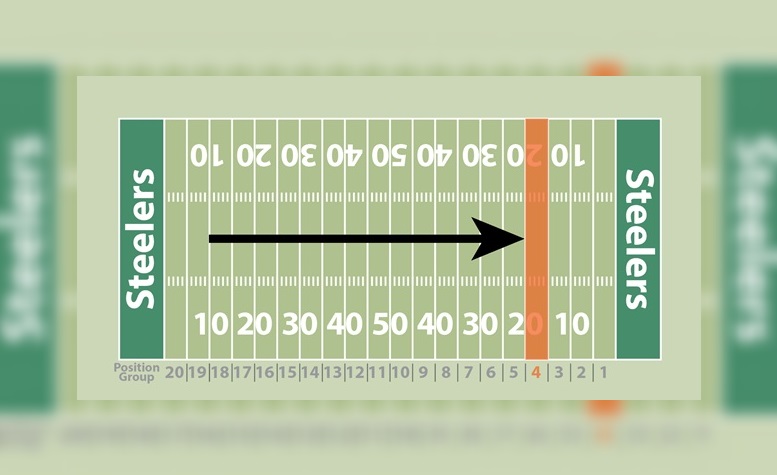
For the series I will be pooling datapoints for starting/ending field position just as I broke down the kicking accuracy by 5-yard distances from the endzone (shown above). My approach was to pick a distance that was divisible by 100 (to evenly split), while avoiding making the size of groups too large or small. The wider the range of locations, the more datapoints, but too much and it may lose relevance. For example, according to pro football reference, from position group 5 and 6 (ball spotted 21-25 and 26-30 yards from the endzone) the accuracy of kickers drops from 83% to 68%.
With that in mind, I assigned a value deemed “expected points” to each field position grouping semi-quantitatively (Table 2). For position groupings 1-3 (ball spotted less than 15 yards from the endzone), since kickers converted more than 95% of kicks, I set the expected points to 3, as relatively every NFL kicker is able to make these kicks consistently. At the other end, for kicks taken in position grouping 9 and 10 (ball spotted greater than 41 yards from the endzone), since so few kicks were attempted, I set only 1 expected point. My motivation for using one point instead of zero points was to give some credit to the offense (future post). For the field positions in between, I multiplied the three points earned by a field goal by the ratio between the percent conversion and the 95% threshold I mentioned earlier. Another way to imagine the ratio is that it represents how far the percent conversion is from being a “gimmie” field goal for NFL kickers instead of to 100%.
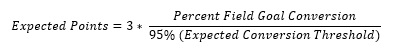
Table 2 – Grouped 2019 Field Goal Conversion Rate
cPoints=Total Field Goal Points-Expected Points
Now to the fun part. If for each kick we subtract the points scored (three if they make it or zero if they miss) from the “expected points” I set earlier, we get the corrected points or cPoints. With that, after adding up this value for every kicker, I ranked them all by cPoints in 2019 (Table 3). The kickers shown below attempted a minimum of 20 kicks (29 kickers). A similar approach was taken with extra points (XP), just with farthest kicks labeled as 0 expected points.
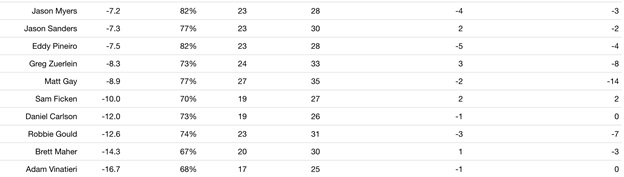
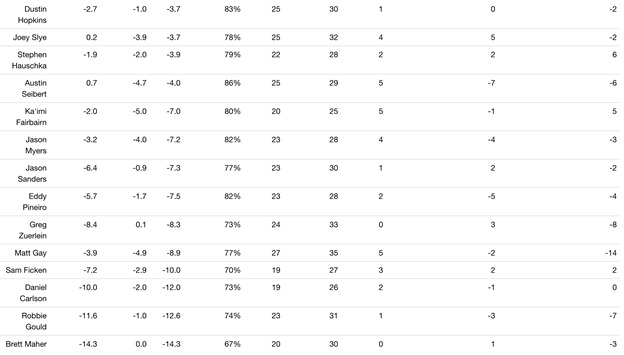
Table 3 – 2019 Ranking of Kickers by Corrected Scoring
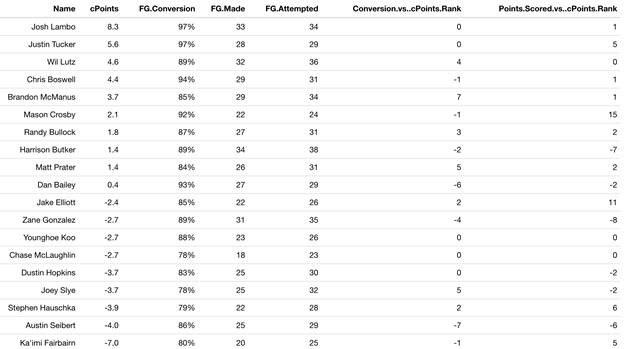
We can imagine cPoints to be similar to how WAR in baseball represents how well the player did compared to how they could be expected to perform. To compare the results shown above to values that again, we as fans may focus on, I calculated how much a player rose or fell in rankings if they were ranked first by conversion percentage or total points scored.
Something that jumped out to me was how much the few kickers who are known to have the leg to attempt very long field goals shot up in the rankings compared to their conversion percentage. Brandon McManus was the biggest jump from this perspective, going up 7 points, although he did not make a kick in 2019 from position group 9-10. The only kicker in 2019 to make two kicks from position group 9-10 was Brett Maher, who only moved up one spot. In that way, the metric values kickers who make longer kicks, but especially penalizes ones who miss shorter kicks.
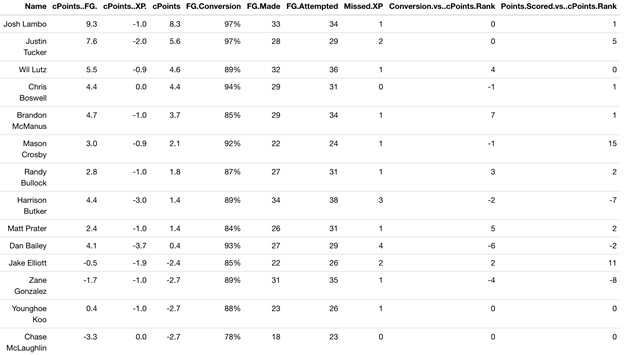
Focusing on the top five, the 2019 AP All-Pro selections Justin Tucker and Josh Lambo were represented as the first two (albeit in reverse order). While according to accuracy they were already the best two in the league, Justin Tucker only attempted the 16th most kicks (Harrison Butker attempted >30% more kicks). By these rankings, he was a victim of how hard it was to force the Ravens in the regular season last year to kick a field goal. Will Lutz, who was third in AP All-Pro voting, ranked third in the cPoints ranking despite a lower conversion rate (89%) compared to peers like Chris Boswell, Mason Crosby, and Dan Bailey (92-94%). For more details, I broke down the kicking statistics by their field goal and extra point components (Table 4).
Interestingly, Brandon McManus made the same number of field goals as Chris Boswell yet had a higher field goal component of cPoints. Part of this may have to do with how 59% of Brandon McManus’ kicks were taken from outside the red zone, or a position grouping of 5 or more, compared to Chris Boswell who only kicked 42% of his kicks. Looking at kicks just a bit further out at a position grouping of 6 or more, the split becomes even more pronounced: 50% for Brandon McManus compared to 26% for Chris Boswell. The inclusion of extra points gives Boswell the nod overall, as he did not miss an extra point (XP) last year.
Rounding things out, there were some notable parts of the cPoints rankings outside the top five. Zane Gonzalez converted at a higher percentage (89%) than Brandon McManus (85%) yet was the 12th (out of 29 eligible kickers) best by cPoints. Harrison Butker (4th in All-Pro Voting) made the most field goals in the NFL last year (34) with a similar conversion rate to Zane Gonzalez (89%) but was ranked 8th. Don Bailey had a similar field goal component of cPoints to Chris Boswell but missed five field goals and fell to the 10th ranking. Finally, Adam Vinatieri missed the most extra points (6), which sunk his cPoints ranking to the last spot.
While these rankings are by no means perfect, I hope they provide a perspective in how balancing a kickers accuracy, leg strength, and number of kicks can shift the rankings of players from statistics we typically use like field goal conversion rates. With this breakdown complete with the kickers, the next article will tackle offenses.
Table 4 – Detailed Breakdown of Kicking Statistics
![]()
![]()


